Climate, environment and AIS fishing effort
Species distributions, marine heatwaves and a climate-fisheries vulnerability index in northern Spain (GSA 6) and the Adriatic (GSAs 17-18)
21 October 2026
Q1 · What drives where red mullet lives?
Question
How do depth and bottom temperature shape red mullet biomass in the two areas?
Approach
Spatio-temporal species distribution model (sdmTMB) of survey biomass, 2014-2021, in each area
Result
Biomass falls steeply with depth and rises with bottom temperature: +17% per °C in the Adriatic. In GSA 6 the temperature effect is uncertain, as surveys there cover a narrow range of temperatures.
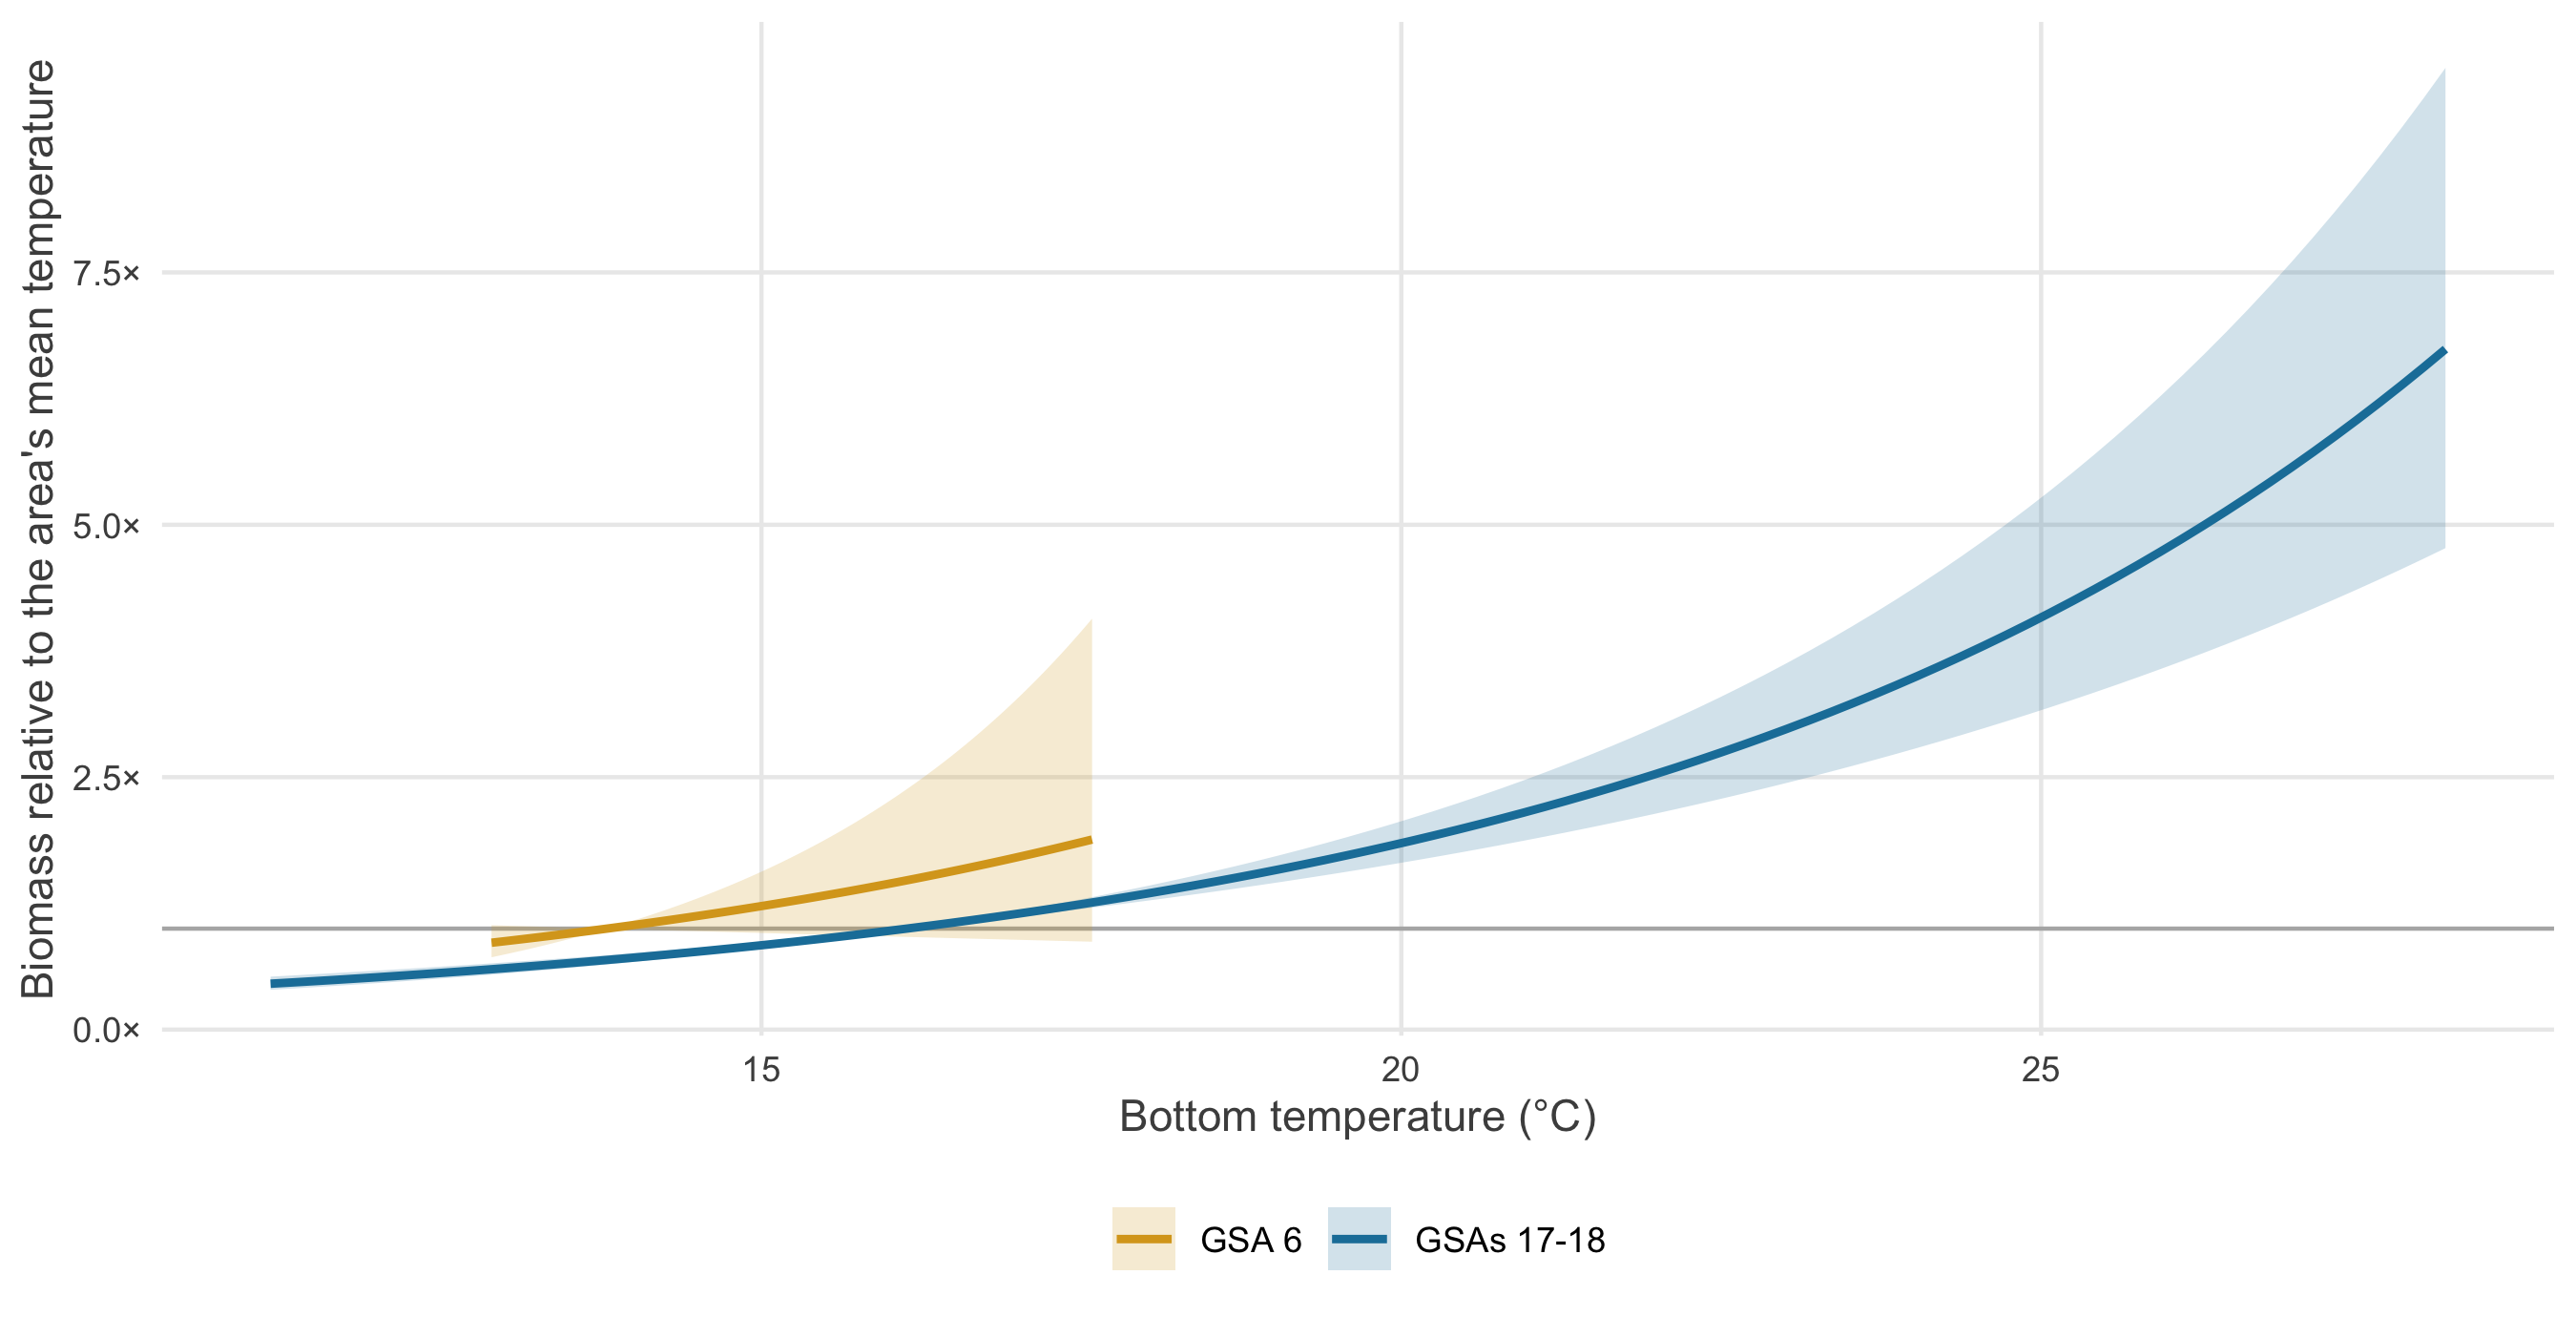
Predicted biomass relative to each area’s mean bottom temperature, at constant depth, with 95% confidence bands.
Q2 · Do heatwaves change red mullet biomass?
Question
Is red mullet biomass lower in summers with strong marine heatwaves?
Approach
Annual biomass index from the model, compared with summer heatwave intensity, 2014-2021
Result
In the Adriatic, biomass drops in the two strongest heatwave summers (2015, 2018) and recovers the next year; in GSA 6 it does not (ρ = 0.53). A hypothesis to test, not yet a result.
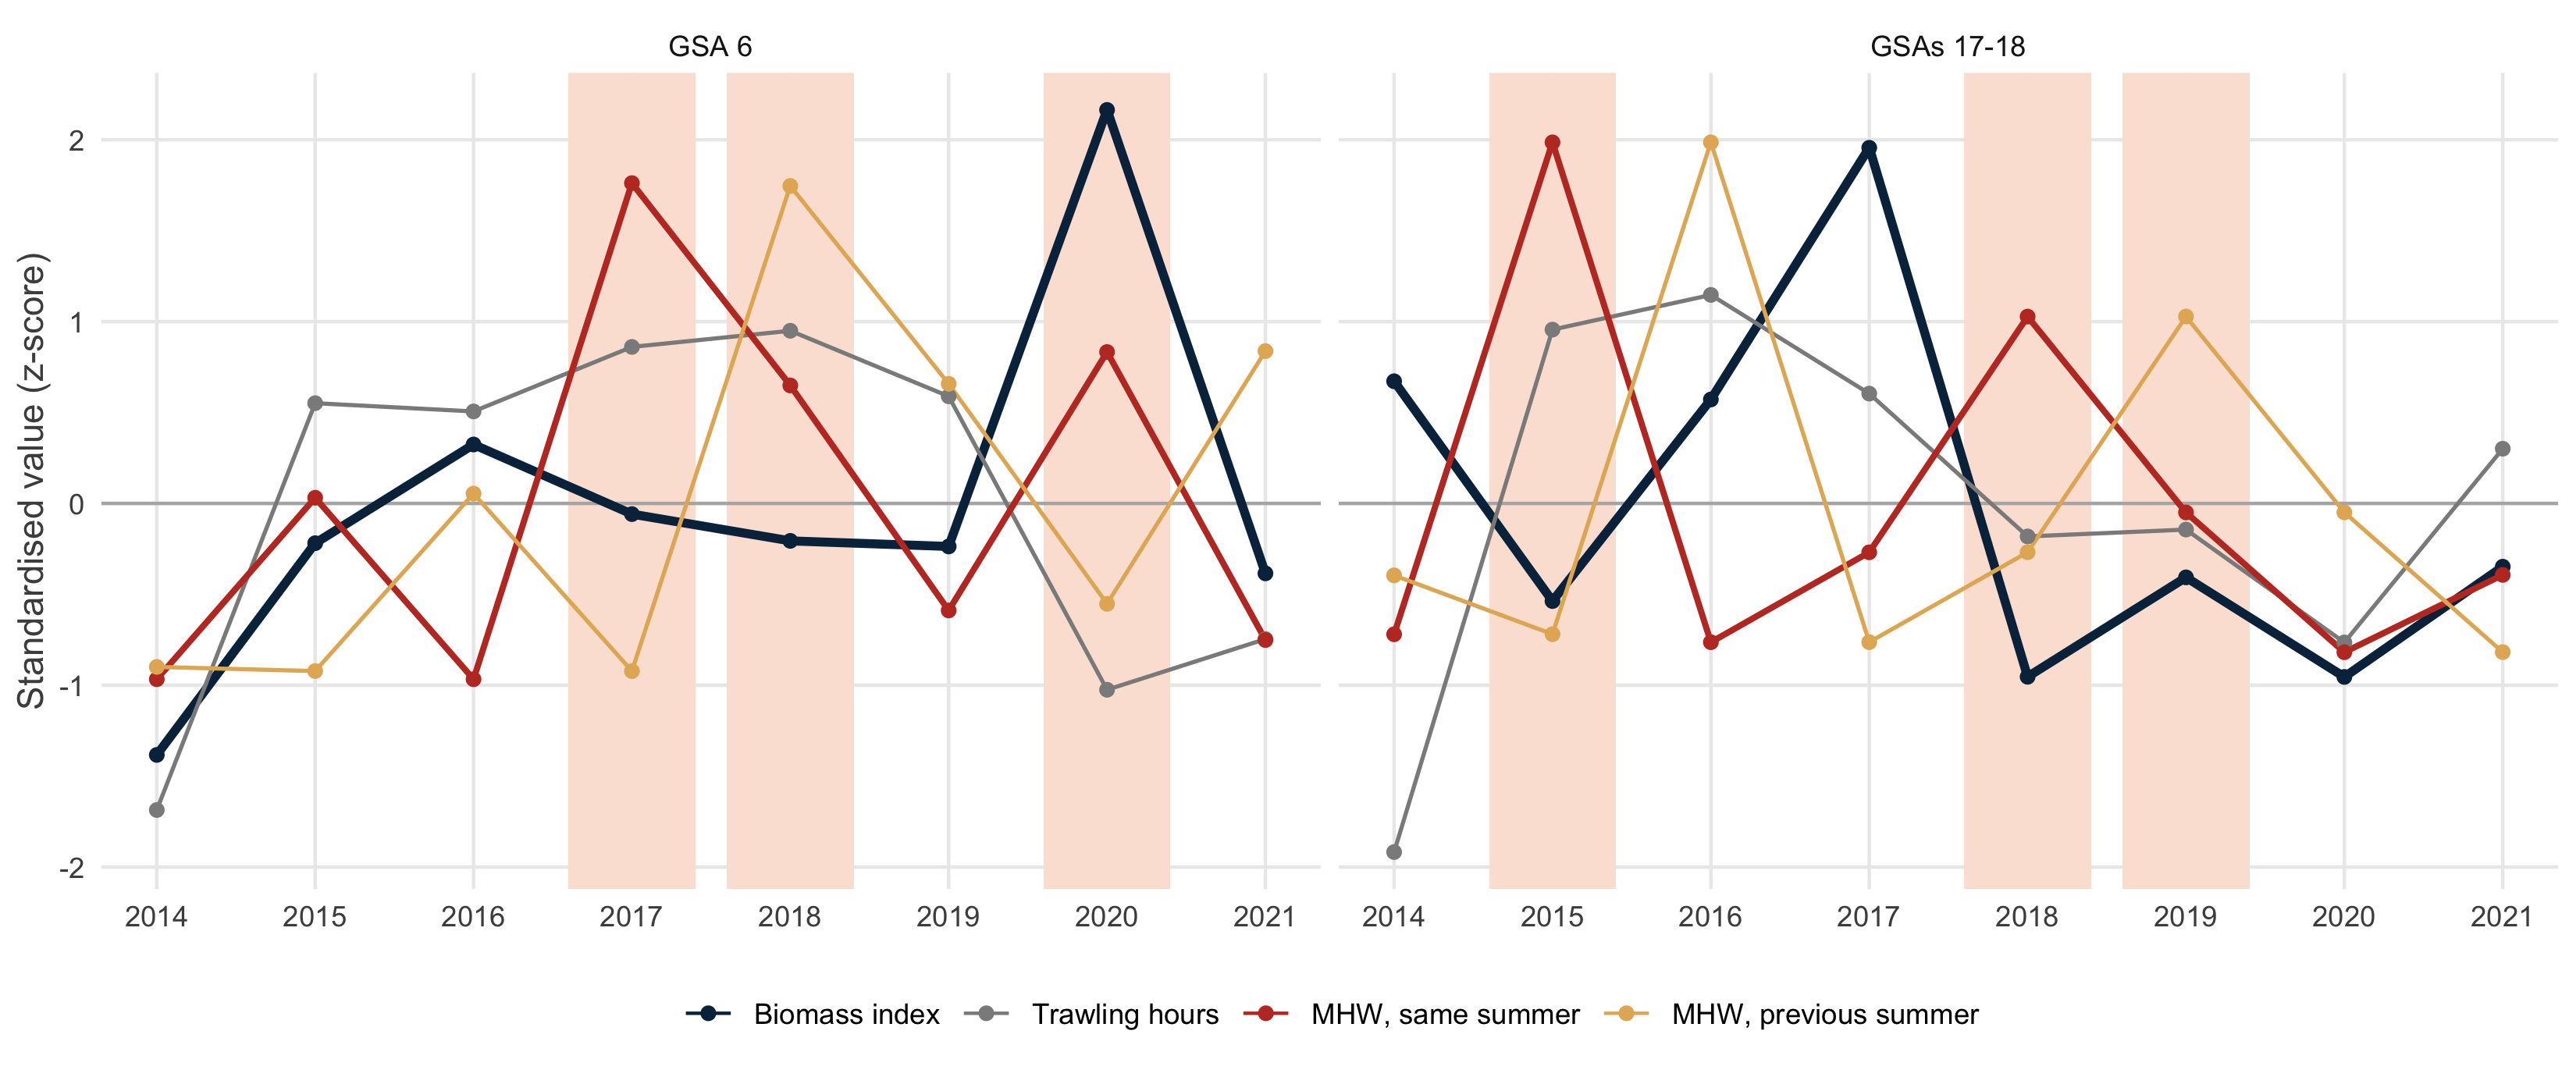
Standardised annual series. Shaded: the three strongest heatwave summers of each area.
Q3 · Do trawlers respond to heatwaves?
Question
Do trawlers fish more, less or elsewhere in strong heatwave summers?
Approach
Daily trawler effort (GFW) in 3 strong vs 3 weak heatwave summers since 2015, in each area
Result
No change: same total effort (+1.9% in GSA 6, -1.3% in the Adriatic) and same grounds. An earlier apparent increase came from AIS coverage growing in 2012-2014.
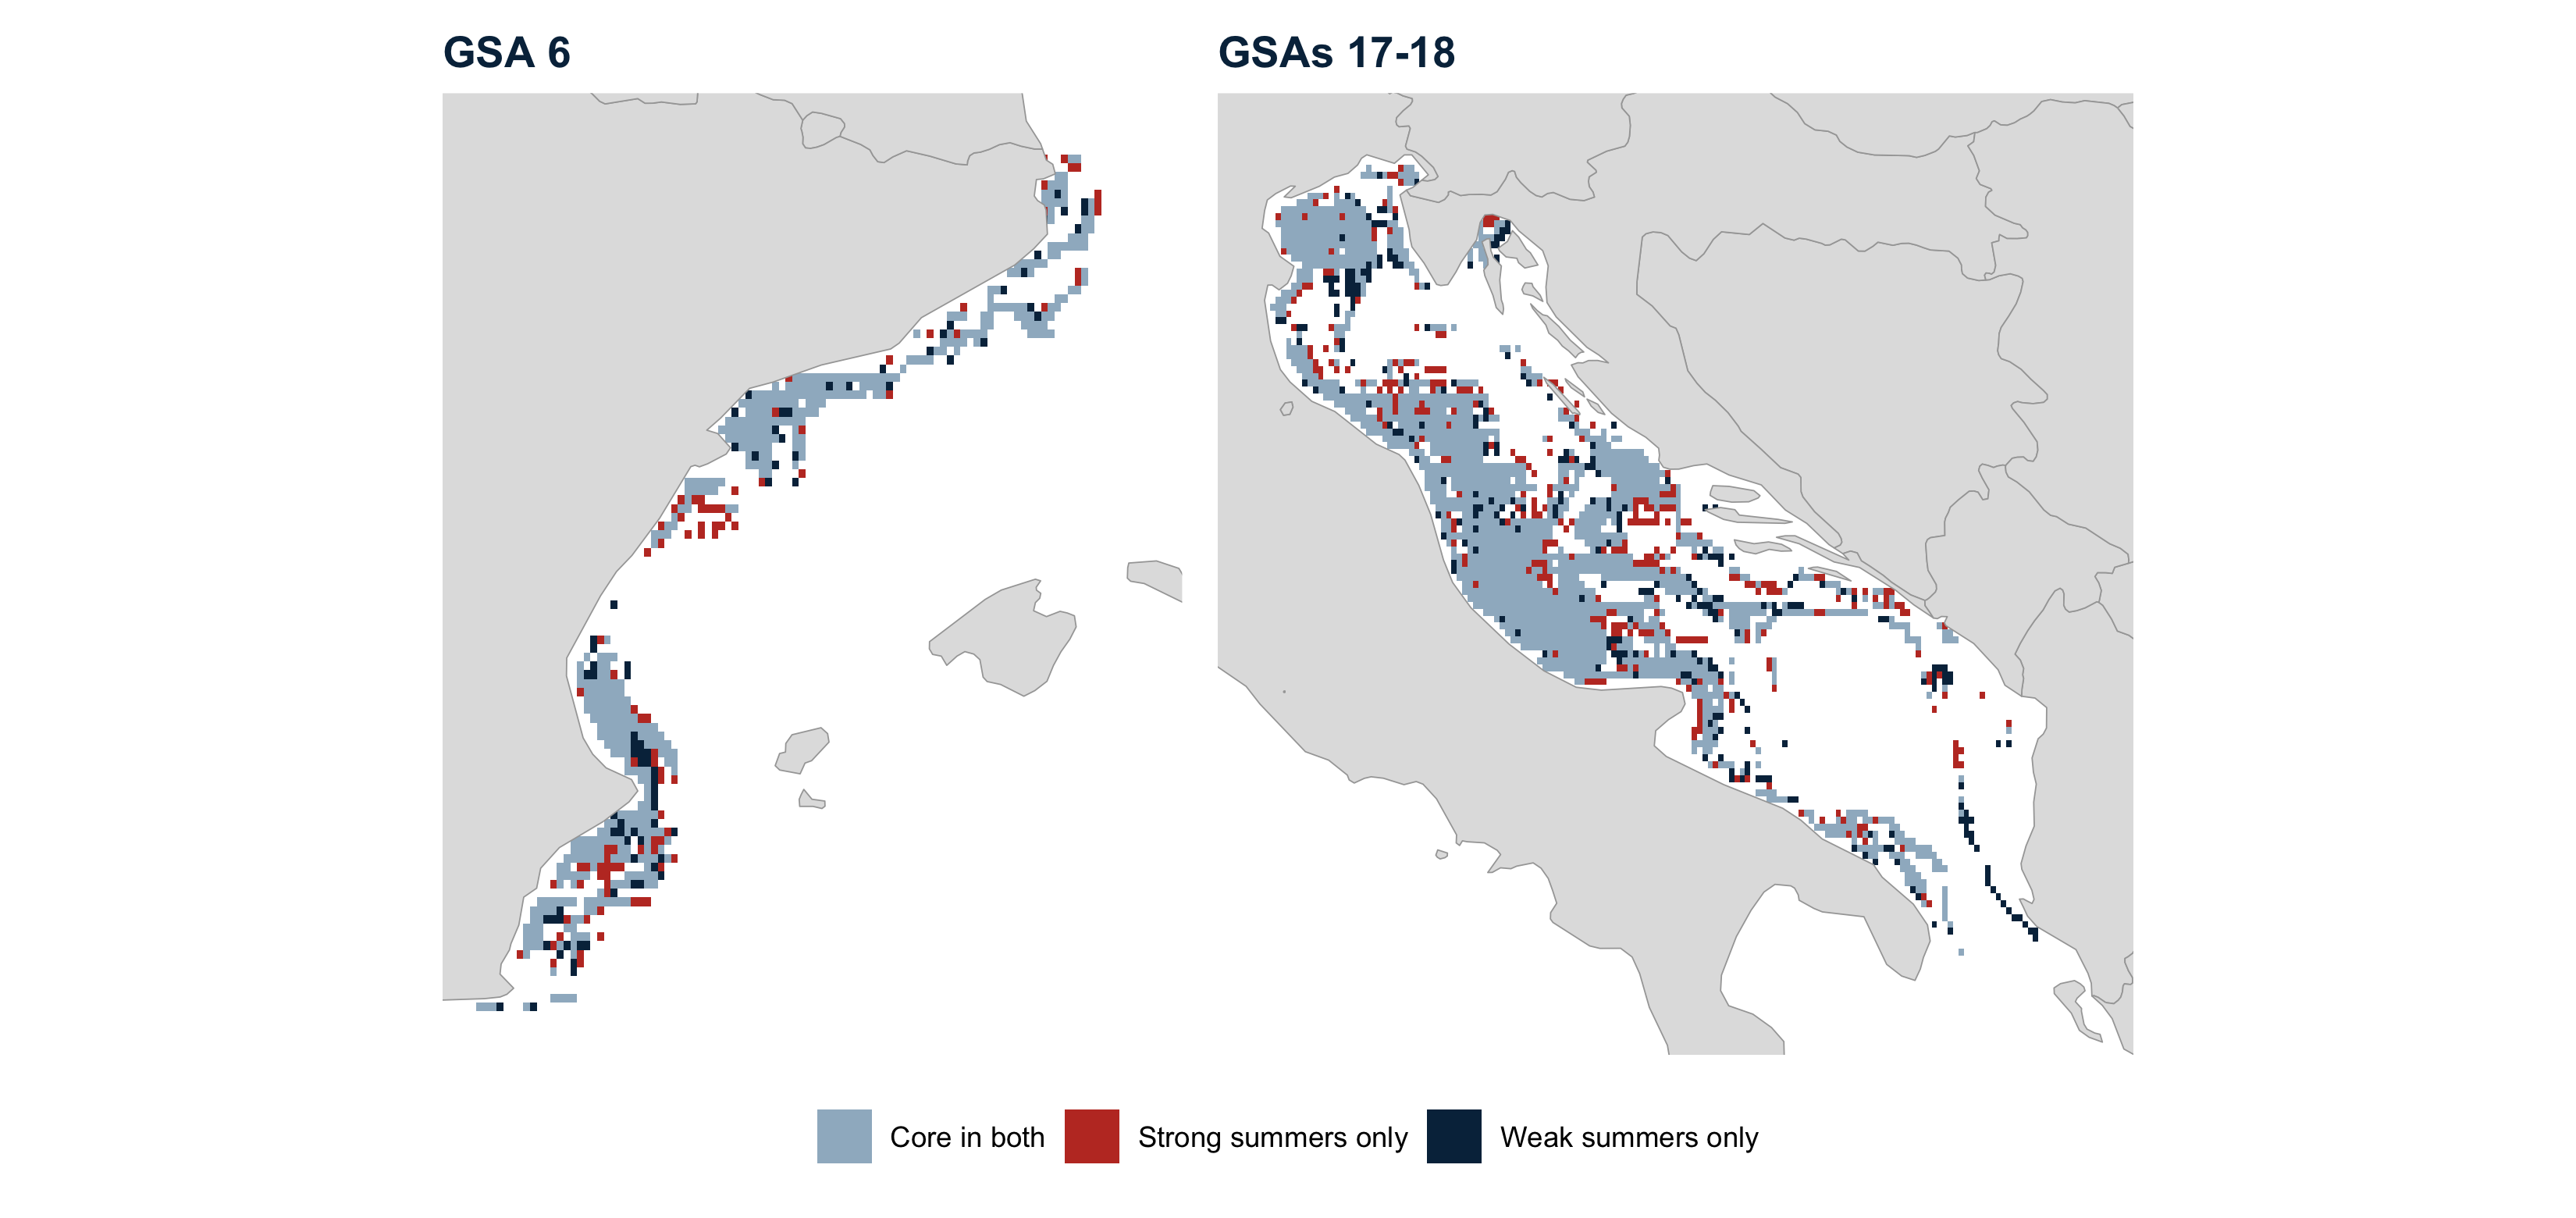
Core fishing grounds (80% of hours): blue-grey in both types of summer; red strong only; dark blue weak only.
Total fish abundance: species distribution model
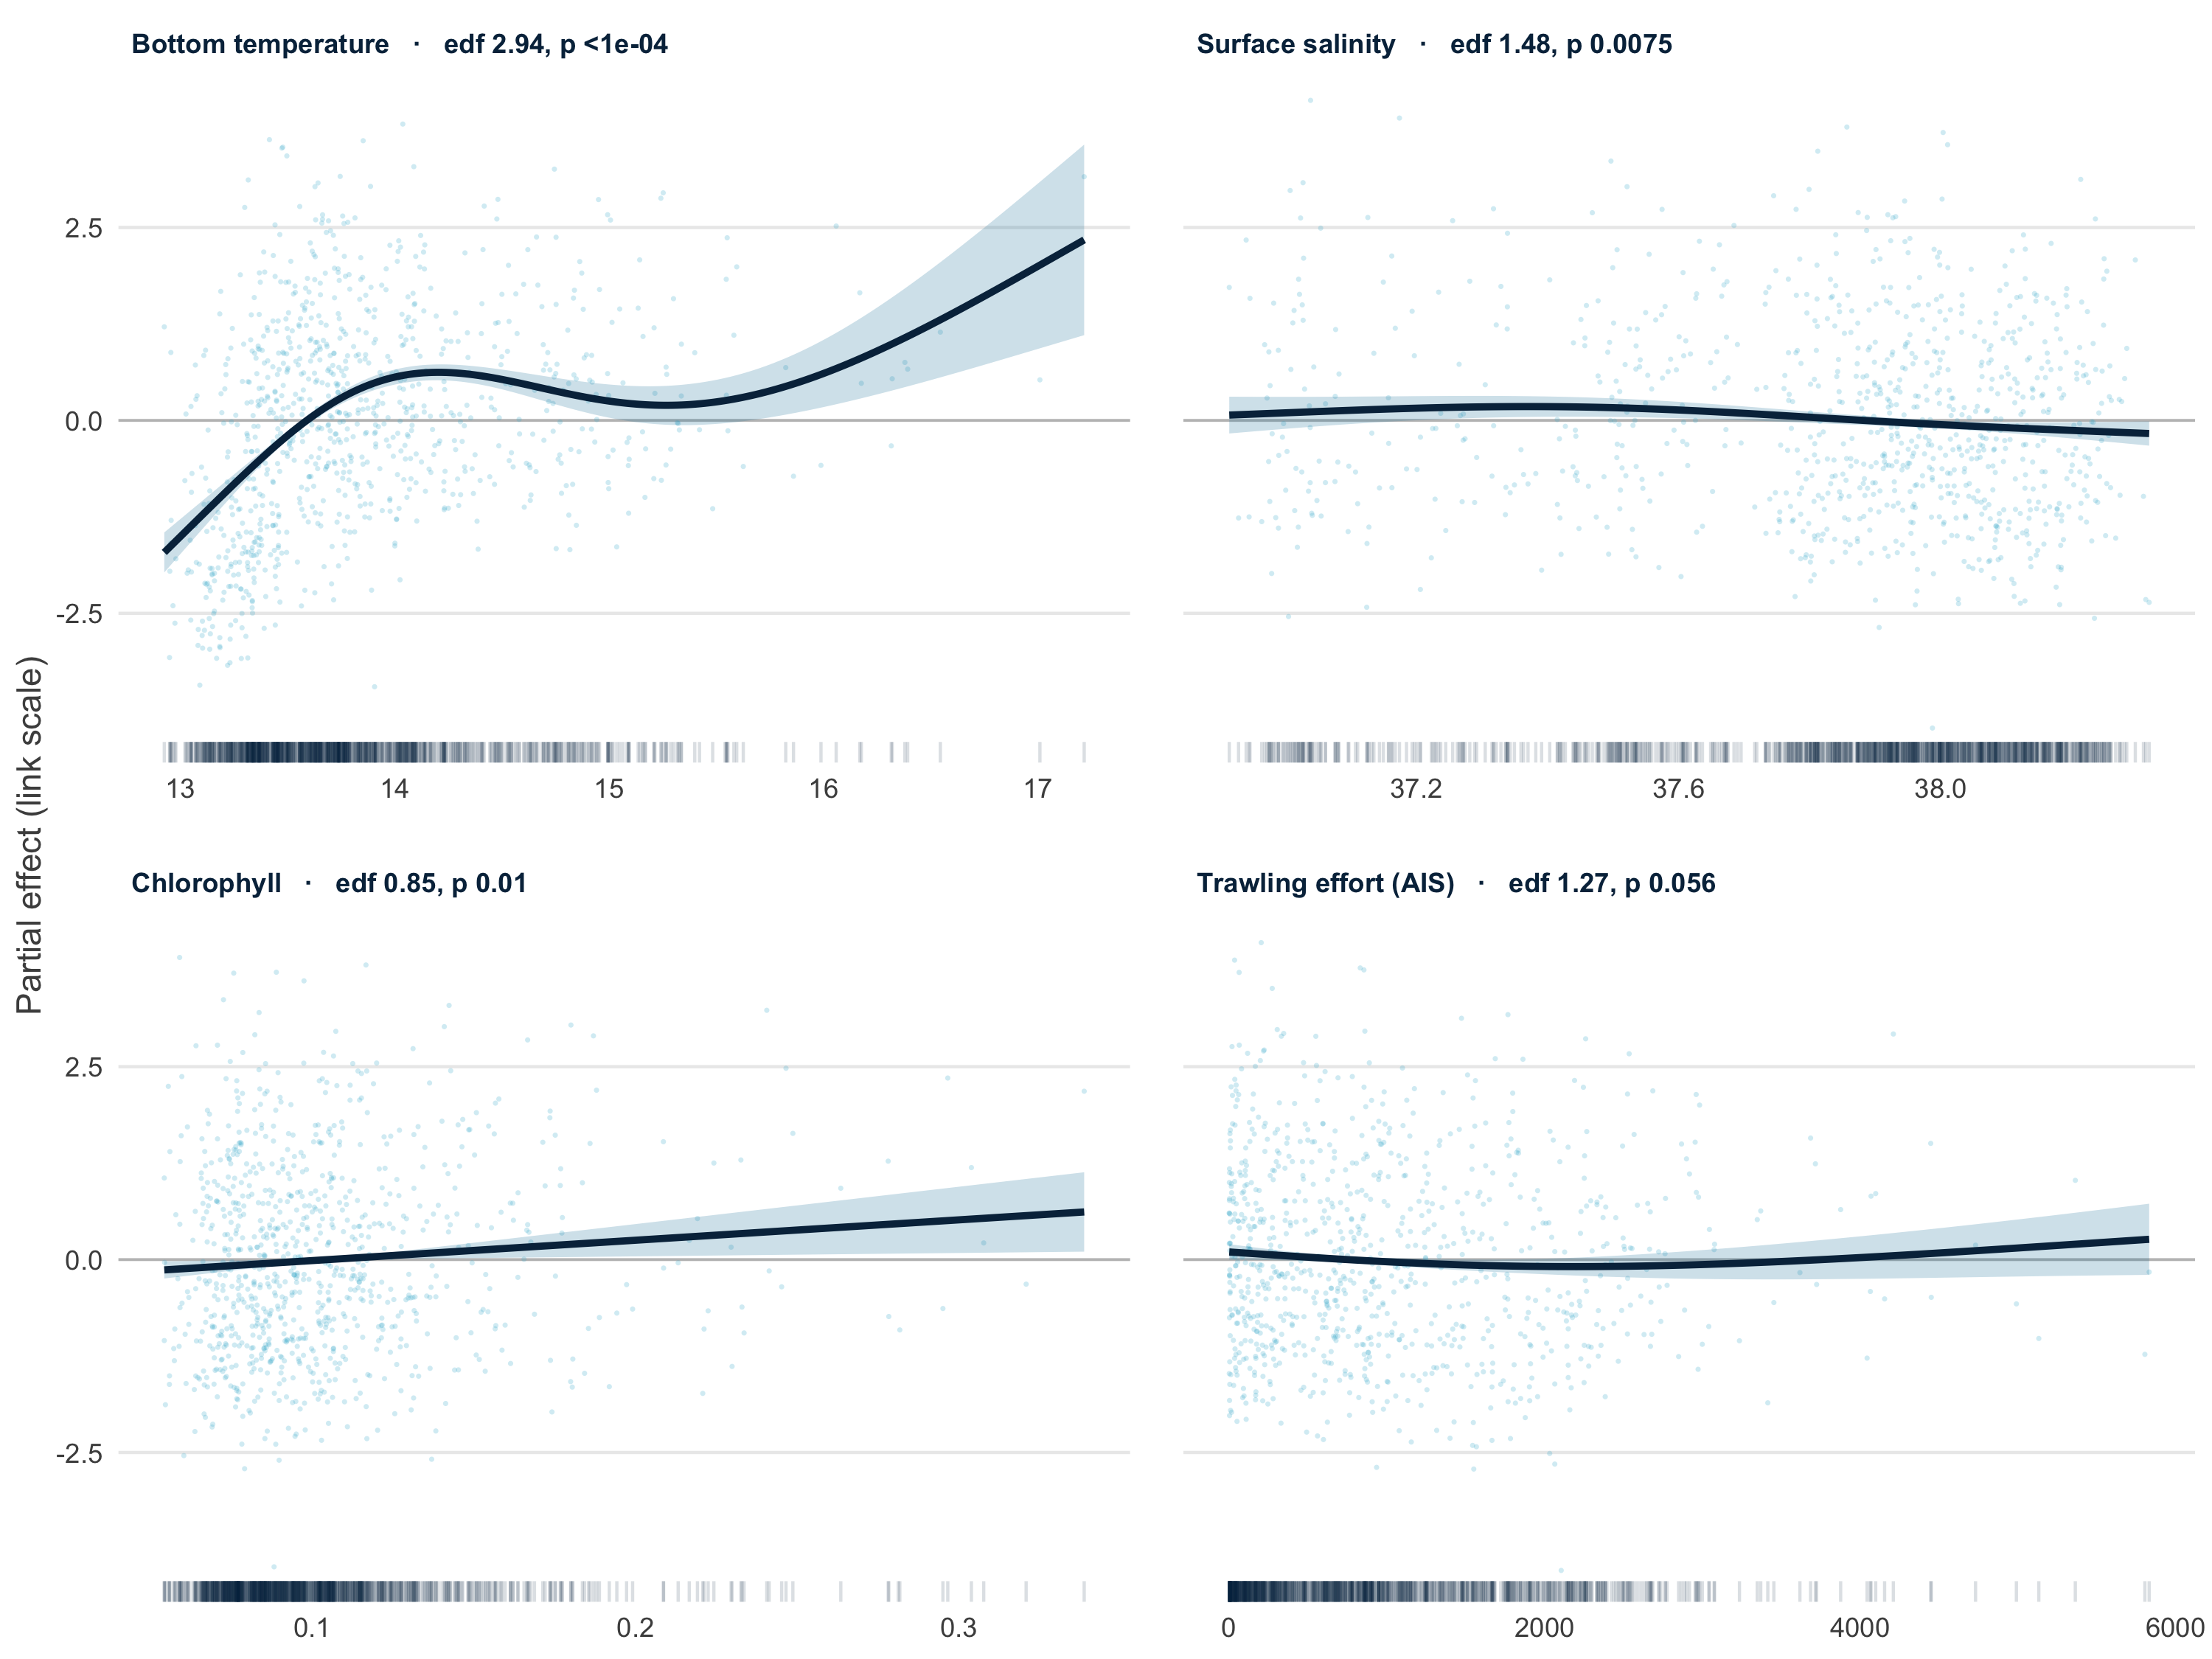
- Gaussian GAM on log total fish abundance, GSA 6, n = 916 hauls
- Bottom temperature carries most of the signal; fishing hours only marginal (p = 0.06)
- About 21% of deviance explained
- SST smooth already shrunk to zero by
select = TRUE
Predicted abundance 2012-2021: median +45% per cell (23% of cells decline), partly reflecting near-zero AIS effort in 2012.
Red mullet: species distribution model
Mullus barbatus (MULLBAR), the group’s focal species
- Zeros kept: caught in 634 of 959 GSA 6 hauls (66%)
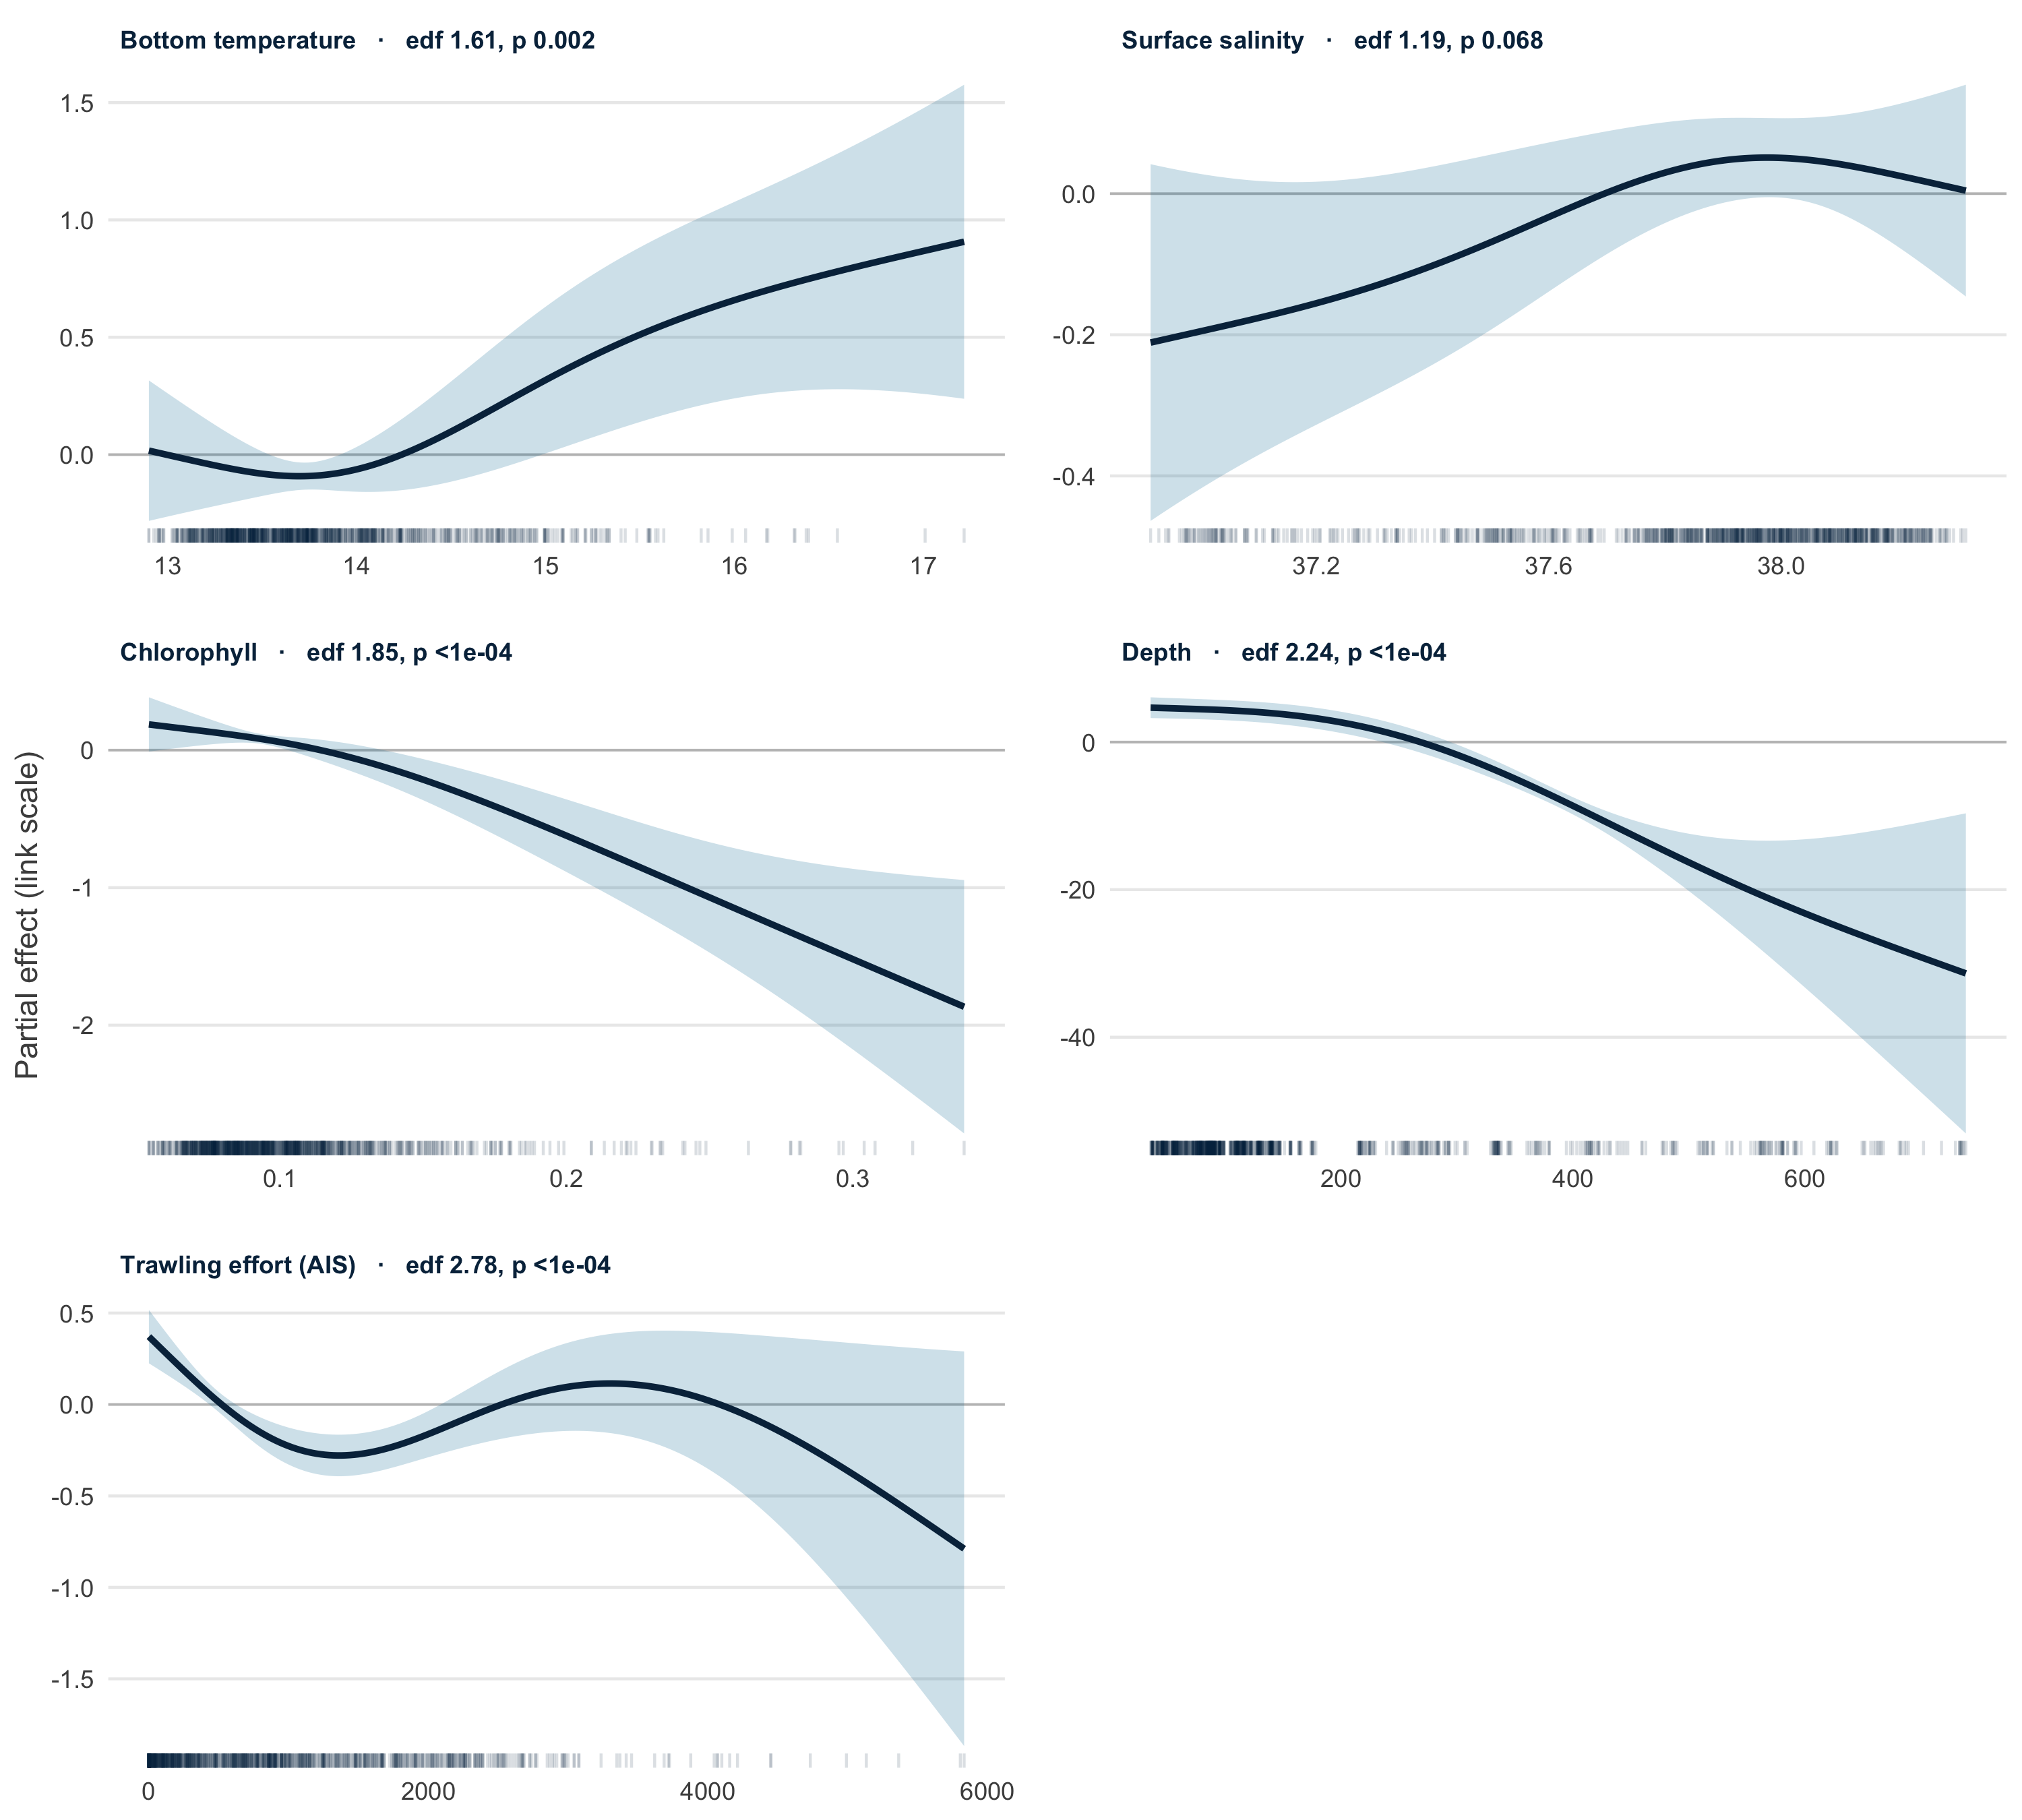
- Tweedie GAM (log link): handles zeros and skewed catches, predicts N/km² directly
- Depth added: deviance explained 20% → 51%, AIC −511
- Density high to ~200 m, then falls steeply; ↑ with bottom temperature, ↓ with chlorophyll
The fishing-hours smooth peaks at zero effort: likely confounding (trawlers target mullet grounds), so treated as a nuisance covariate.
Red mullet: habitat change 2015-2021
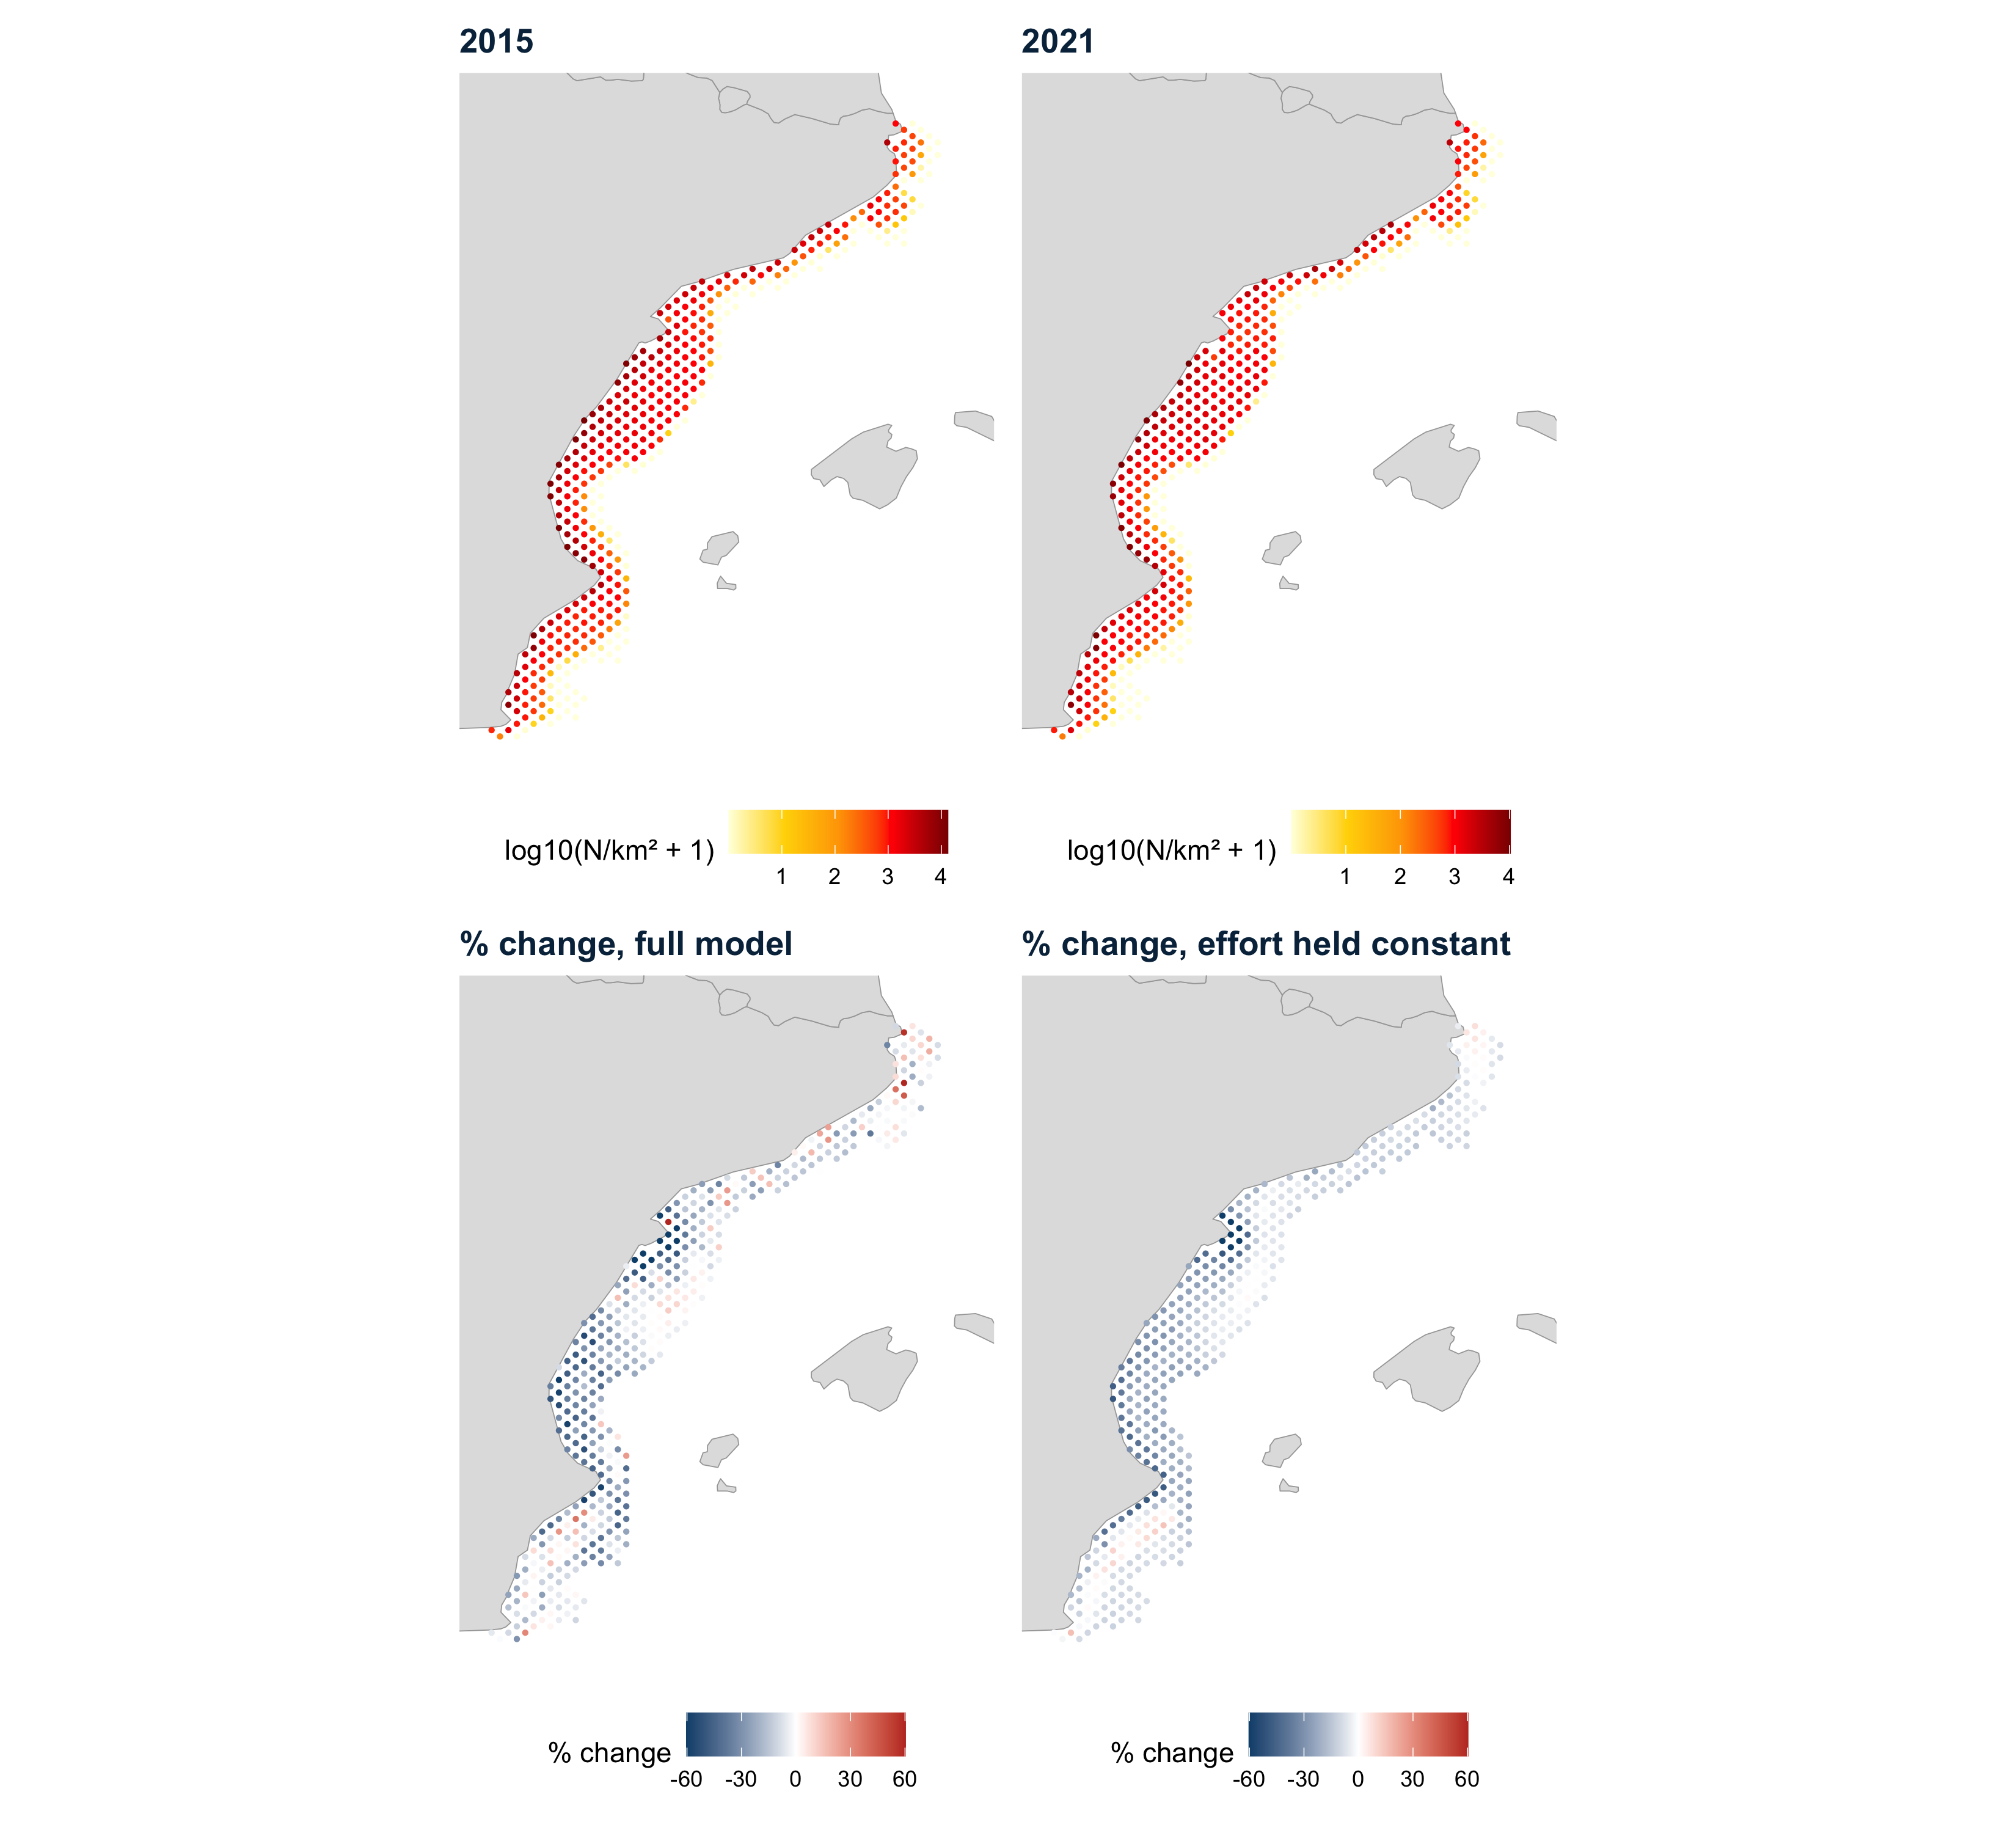
June predictions on the Copernicus hindcast grid, within the sampled depth range; change computed after the AIS ramp-up
−12% median change per cell with effort held constant (−12% with the full model)
92% of 416 cells decline with effort held constant (range −77% to +16%)
Mean bottom temperature is similar in 2015 and 2021, so the decline is not simply warming. Driver not yet identified.
Bottom temperature: two areas compared
+17% biomass per +1 °C in the Adriatic (95% CI +14% to +21%)
+18% per +1 °C in GSA 6 (95% CI −4% to +45%): not significant
Discussion point: GSA 6 hauls span a narrow range of bottom temperatures, so the effect is poorly constrained there and depth dominates.
Biomass index
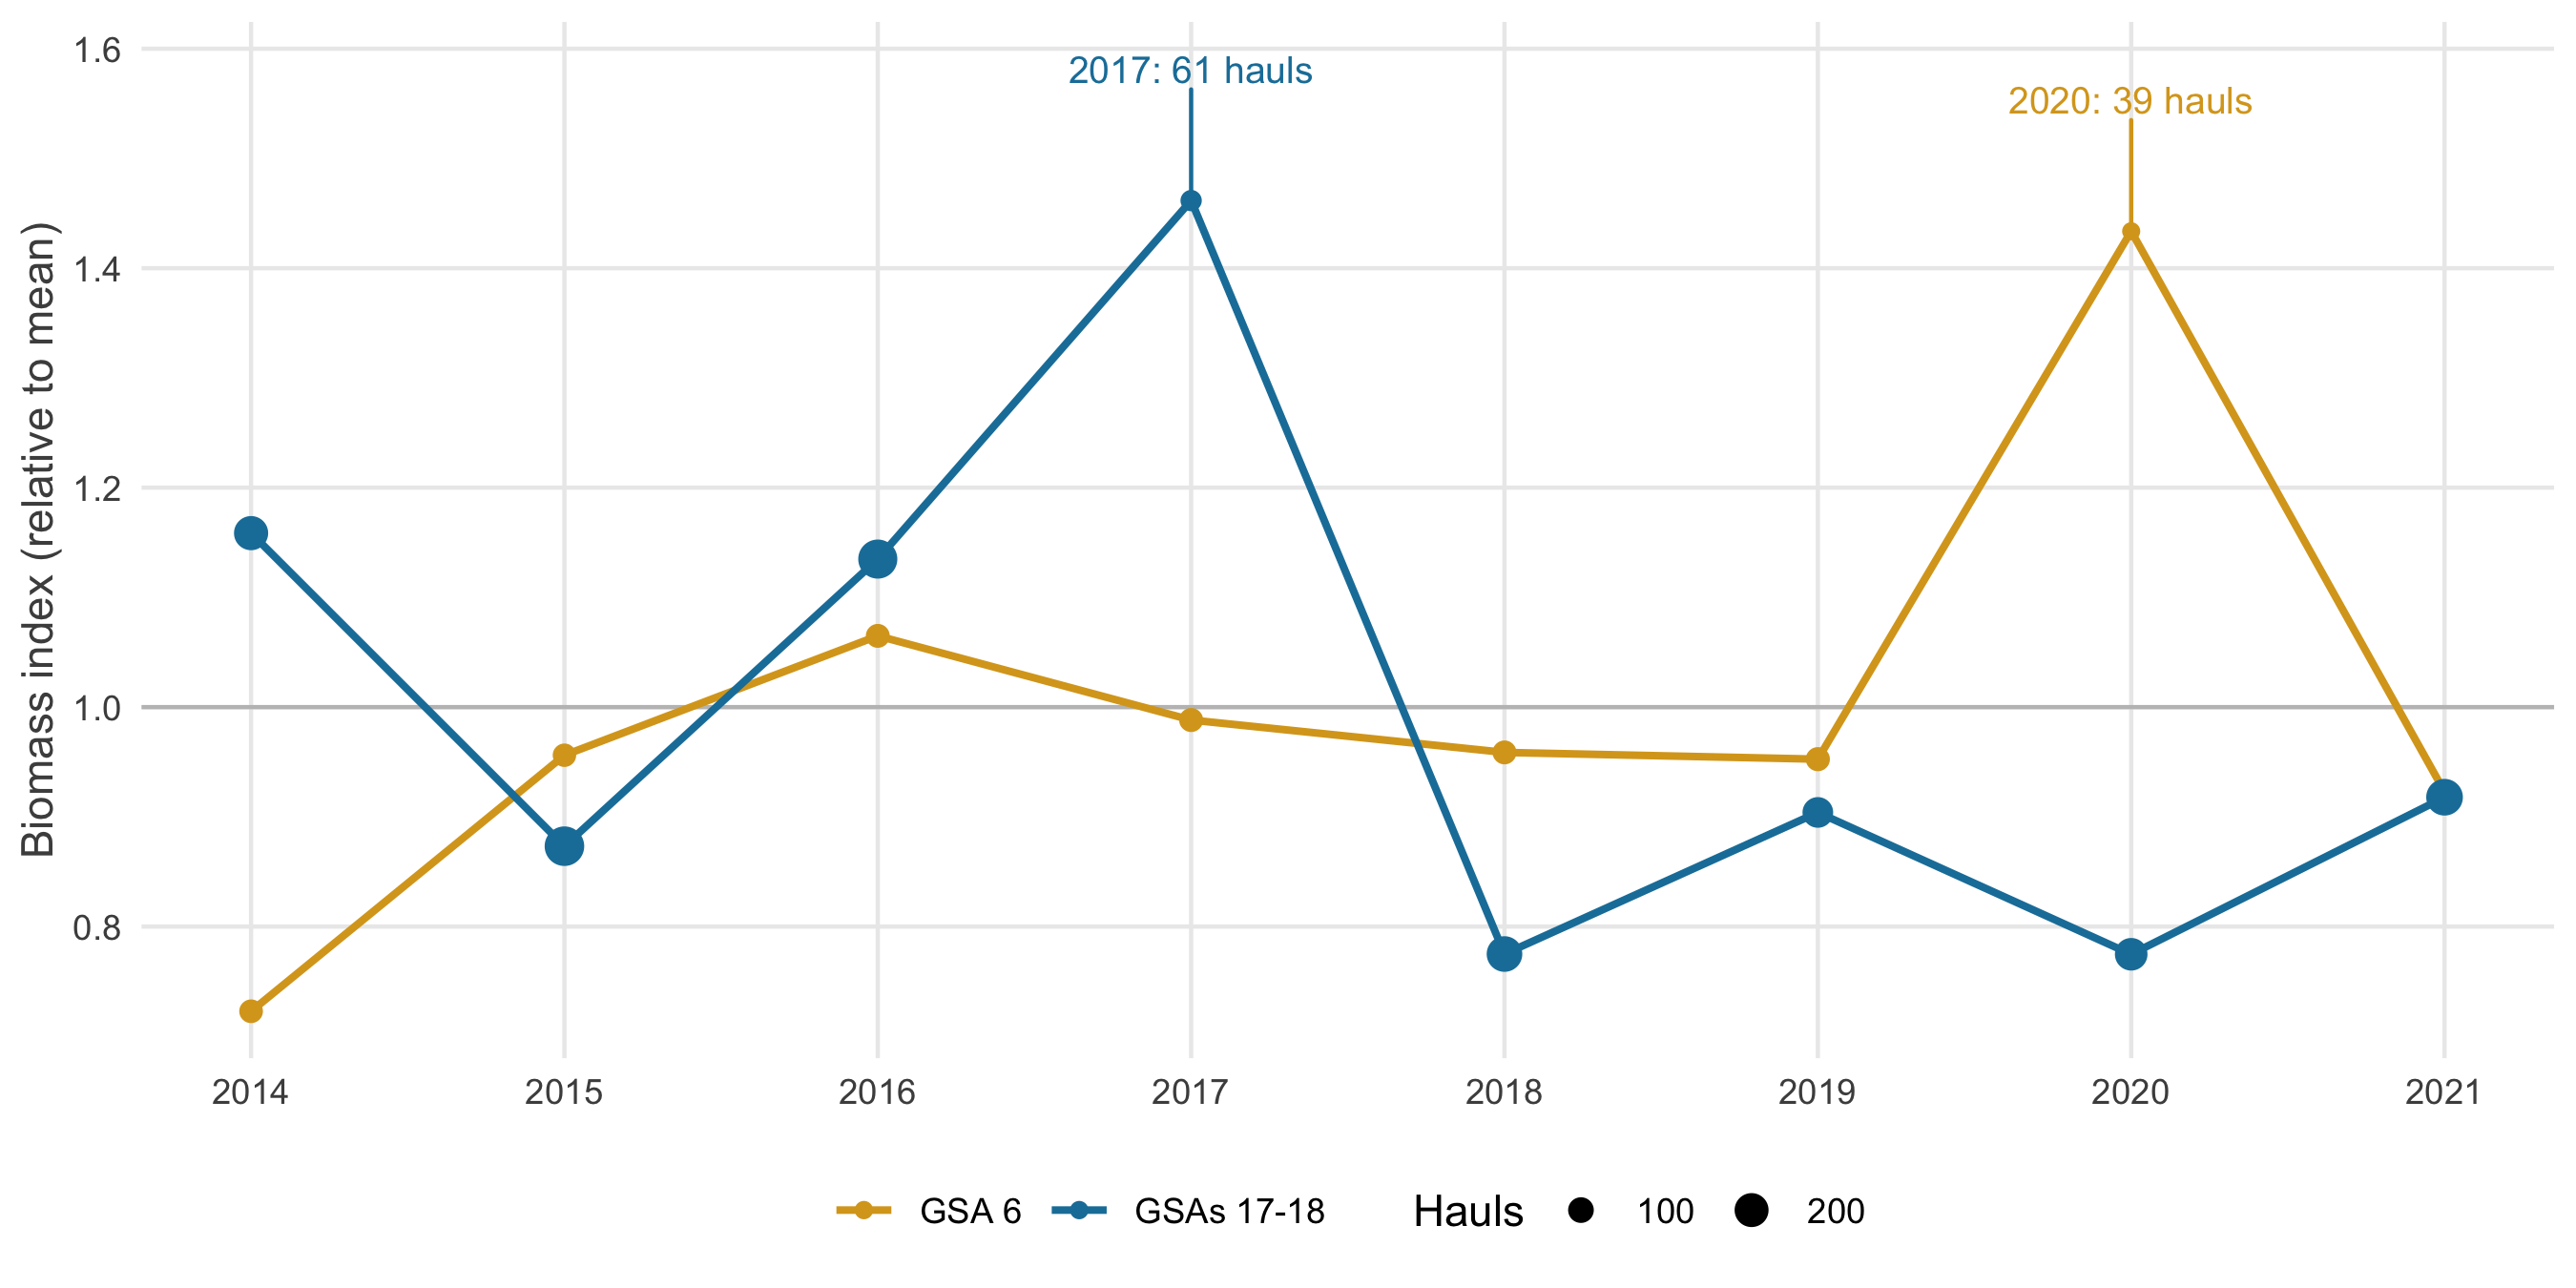
−3% GSA 6, 2015 → 2021 (Tweedie GAM: −12% in density)
77% to 146% The Adriatic index fluctuates more, between 77% and 146% of its 2014-2021 mean
Discussion point: each area peaks in its least-sampled year (GSA 6 2020: 39 hauls; Adriatic 2017: 61). Needs index standard errors.
Habitat suitability index (HSI)
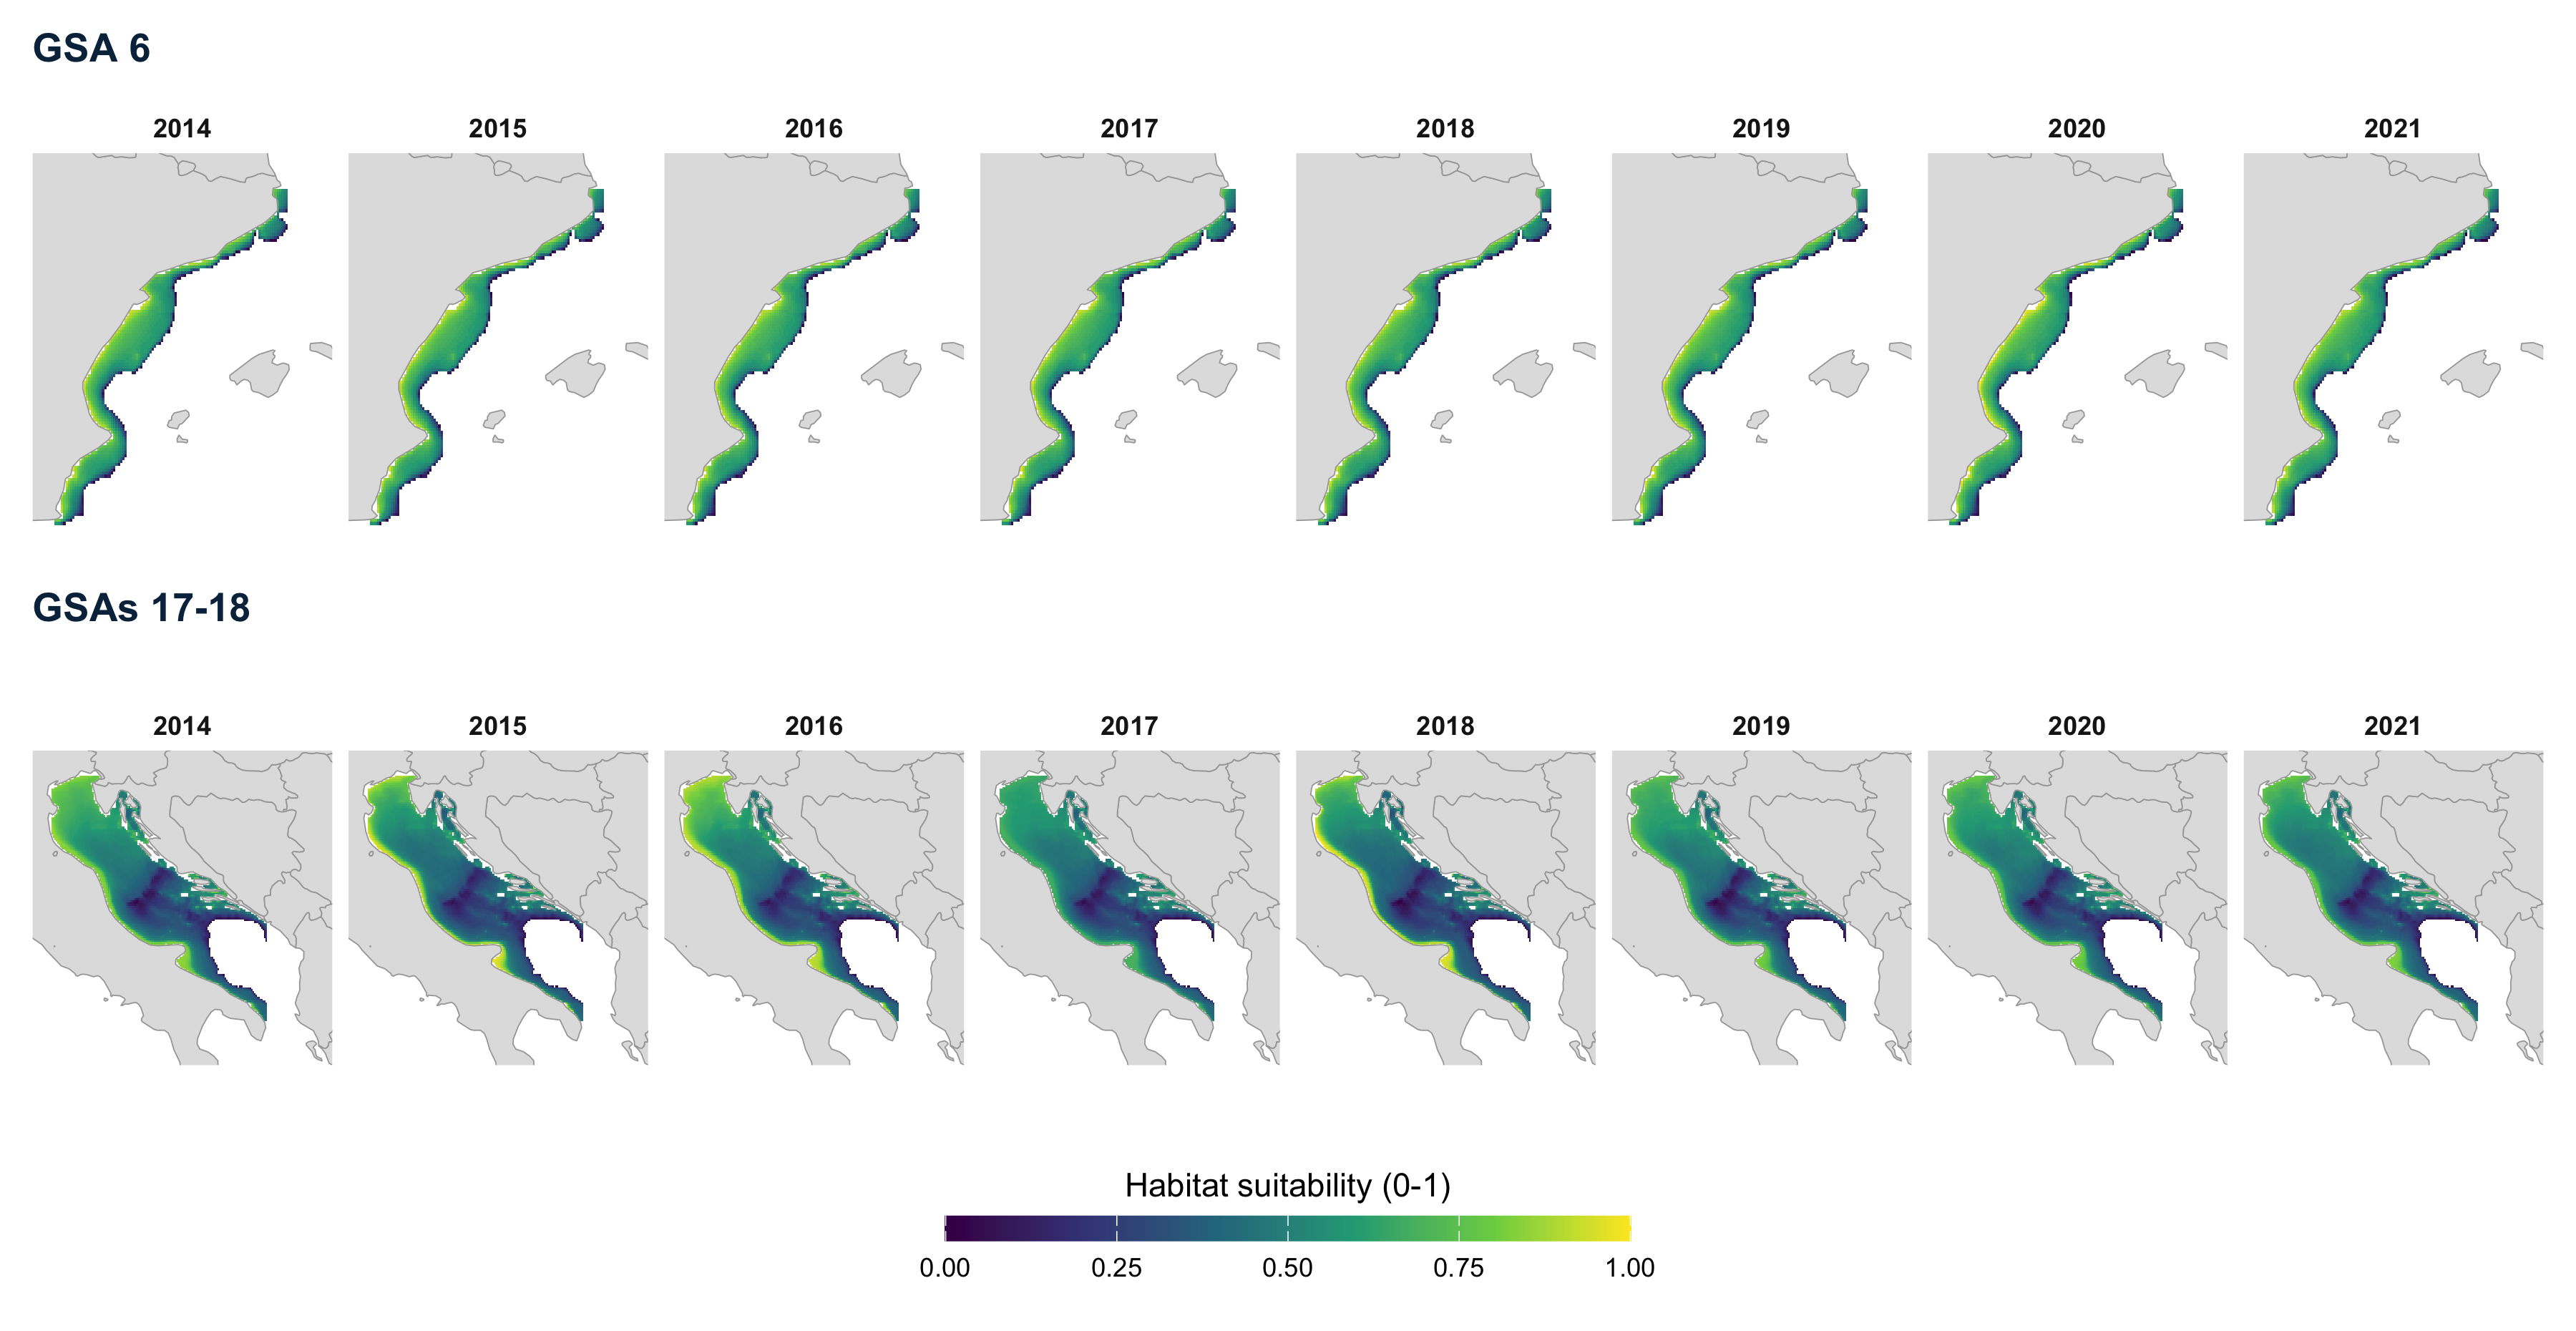
Fixed effects (depth + bottom temperature) rescaled to 0-1 within each area. Highest on the shallow inner shelf; in the Adriatic, the northern basin scores high almost everywhere.
Change in habitat suitability, 2014 to 2021
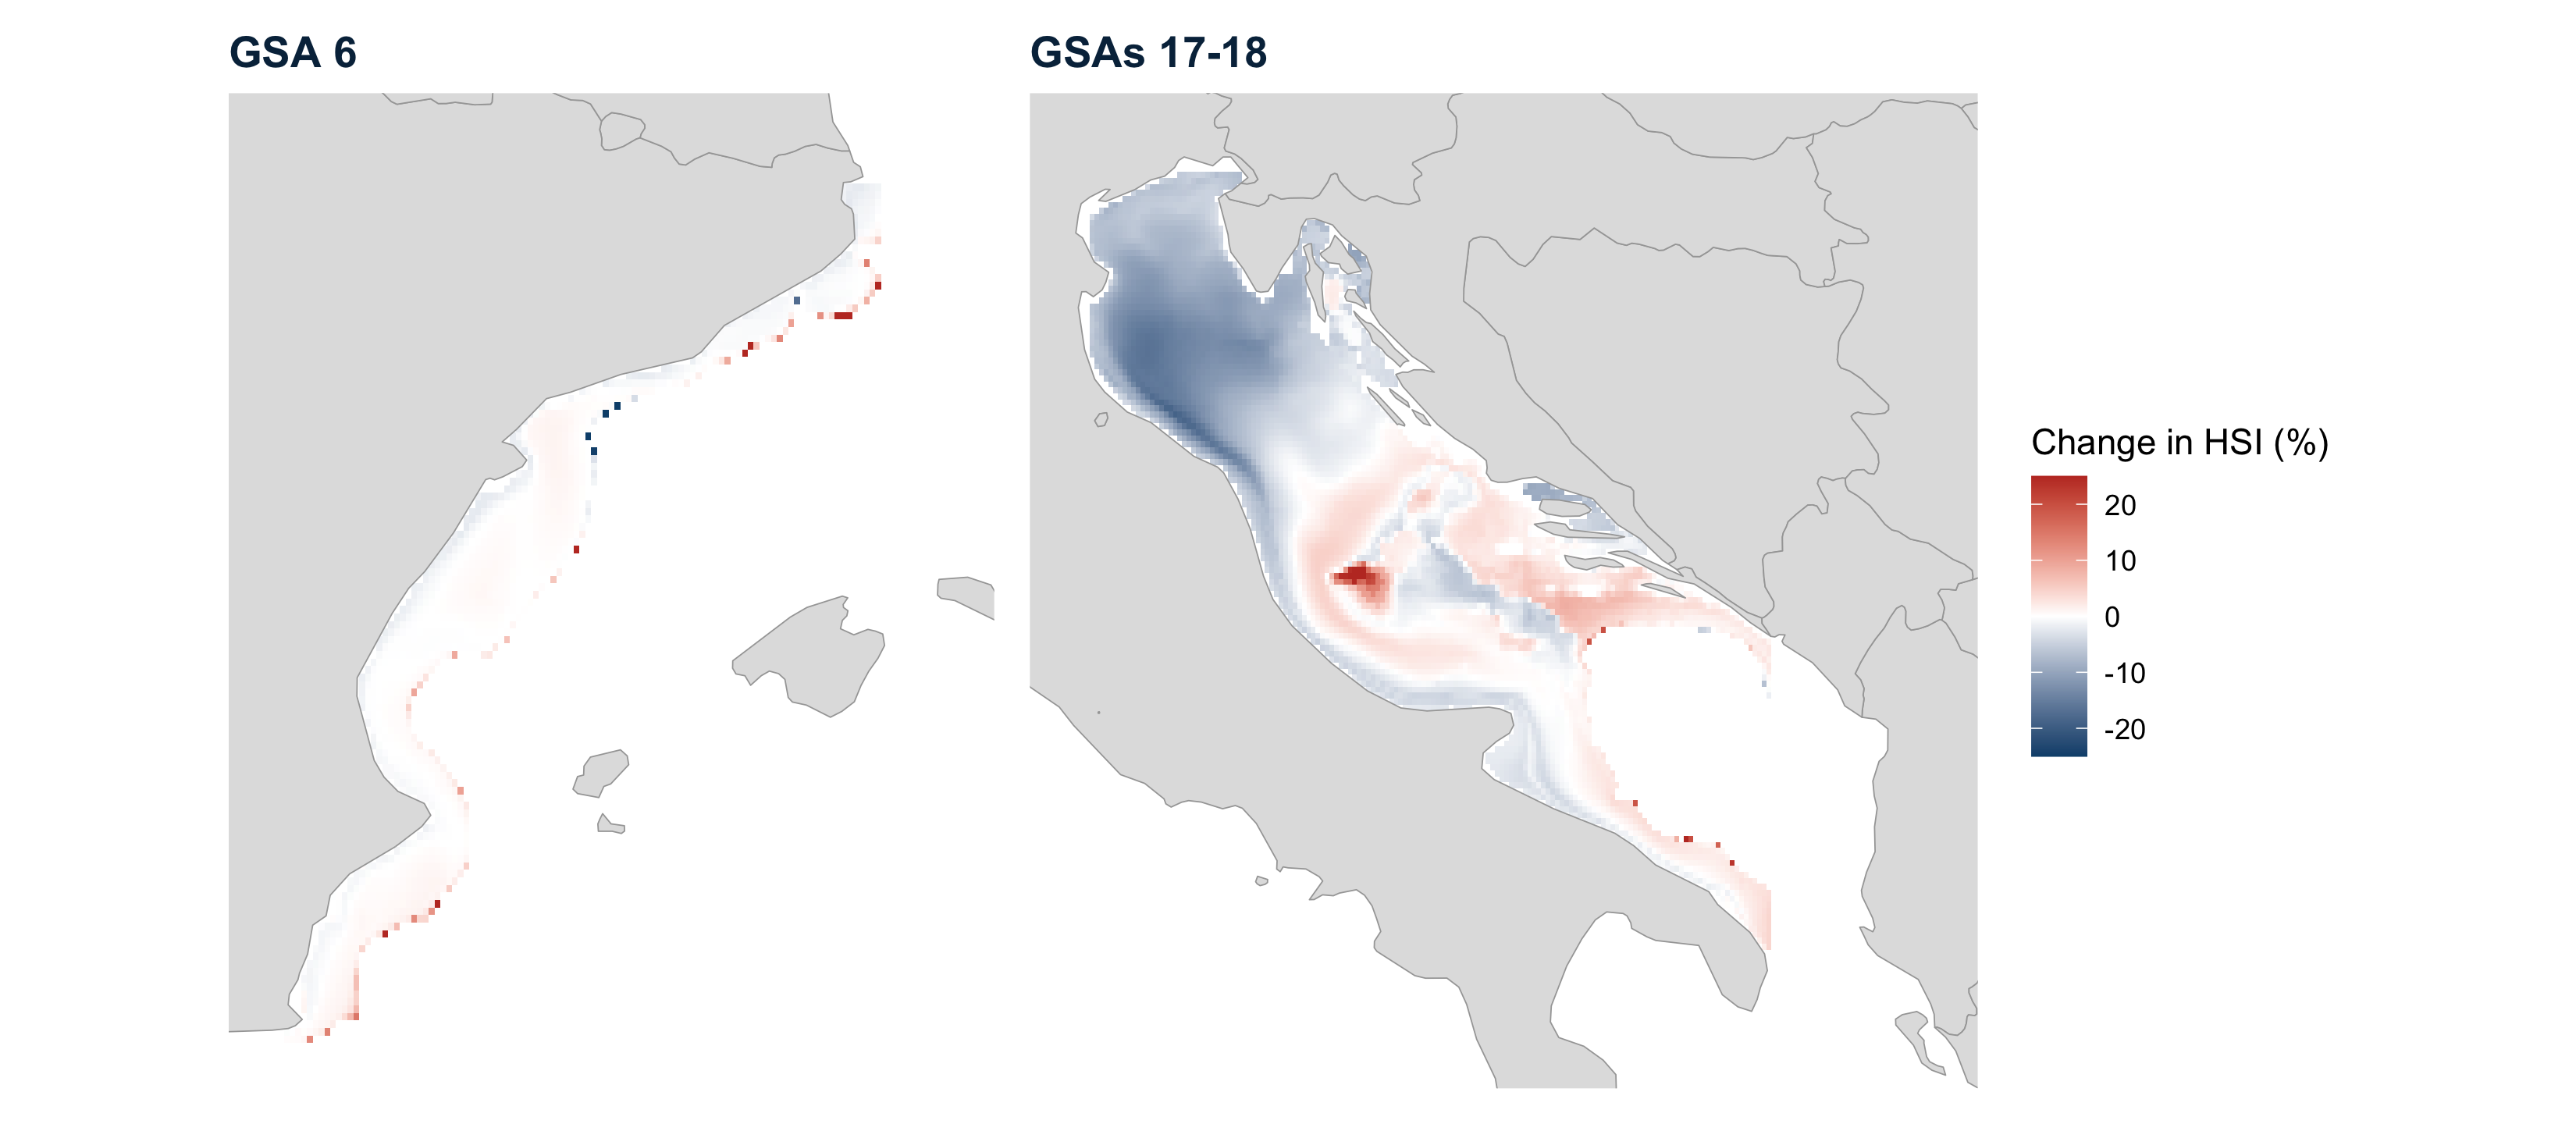
- GSA 6: median +0.1%, almost no change
- Adriatic: median −1.8%; 63% of cells lose suitability, mainly the northern basin
Discussion point: the % change explodes where HSI ≈ 0 (up to +217% in one GSA 6 cell): prefer the HSI difference or a 2014-2021 trend.
Overlap between red mullet and trawling

Local correlation between red mullet and GFW trawling effort, by year
- Red: trawling concentrated where red mullet is abundant
- GSA 6: mostly negative, positive patches on the outer shelf
- Adriatic: a positive band through the north-western and central basin every year
Discussion point: correlations near ±1 are common in small windows: add a significance test or a whole-area overlap measure.
Marine heatwaves in the two areas
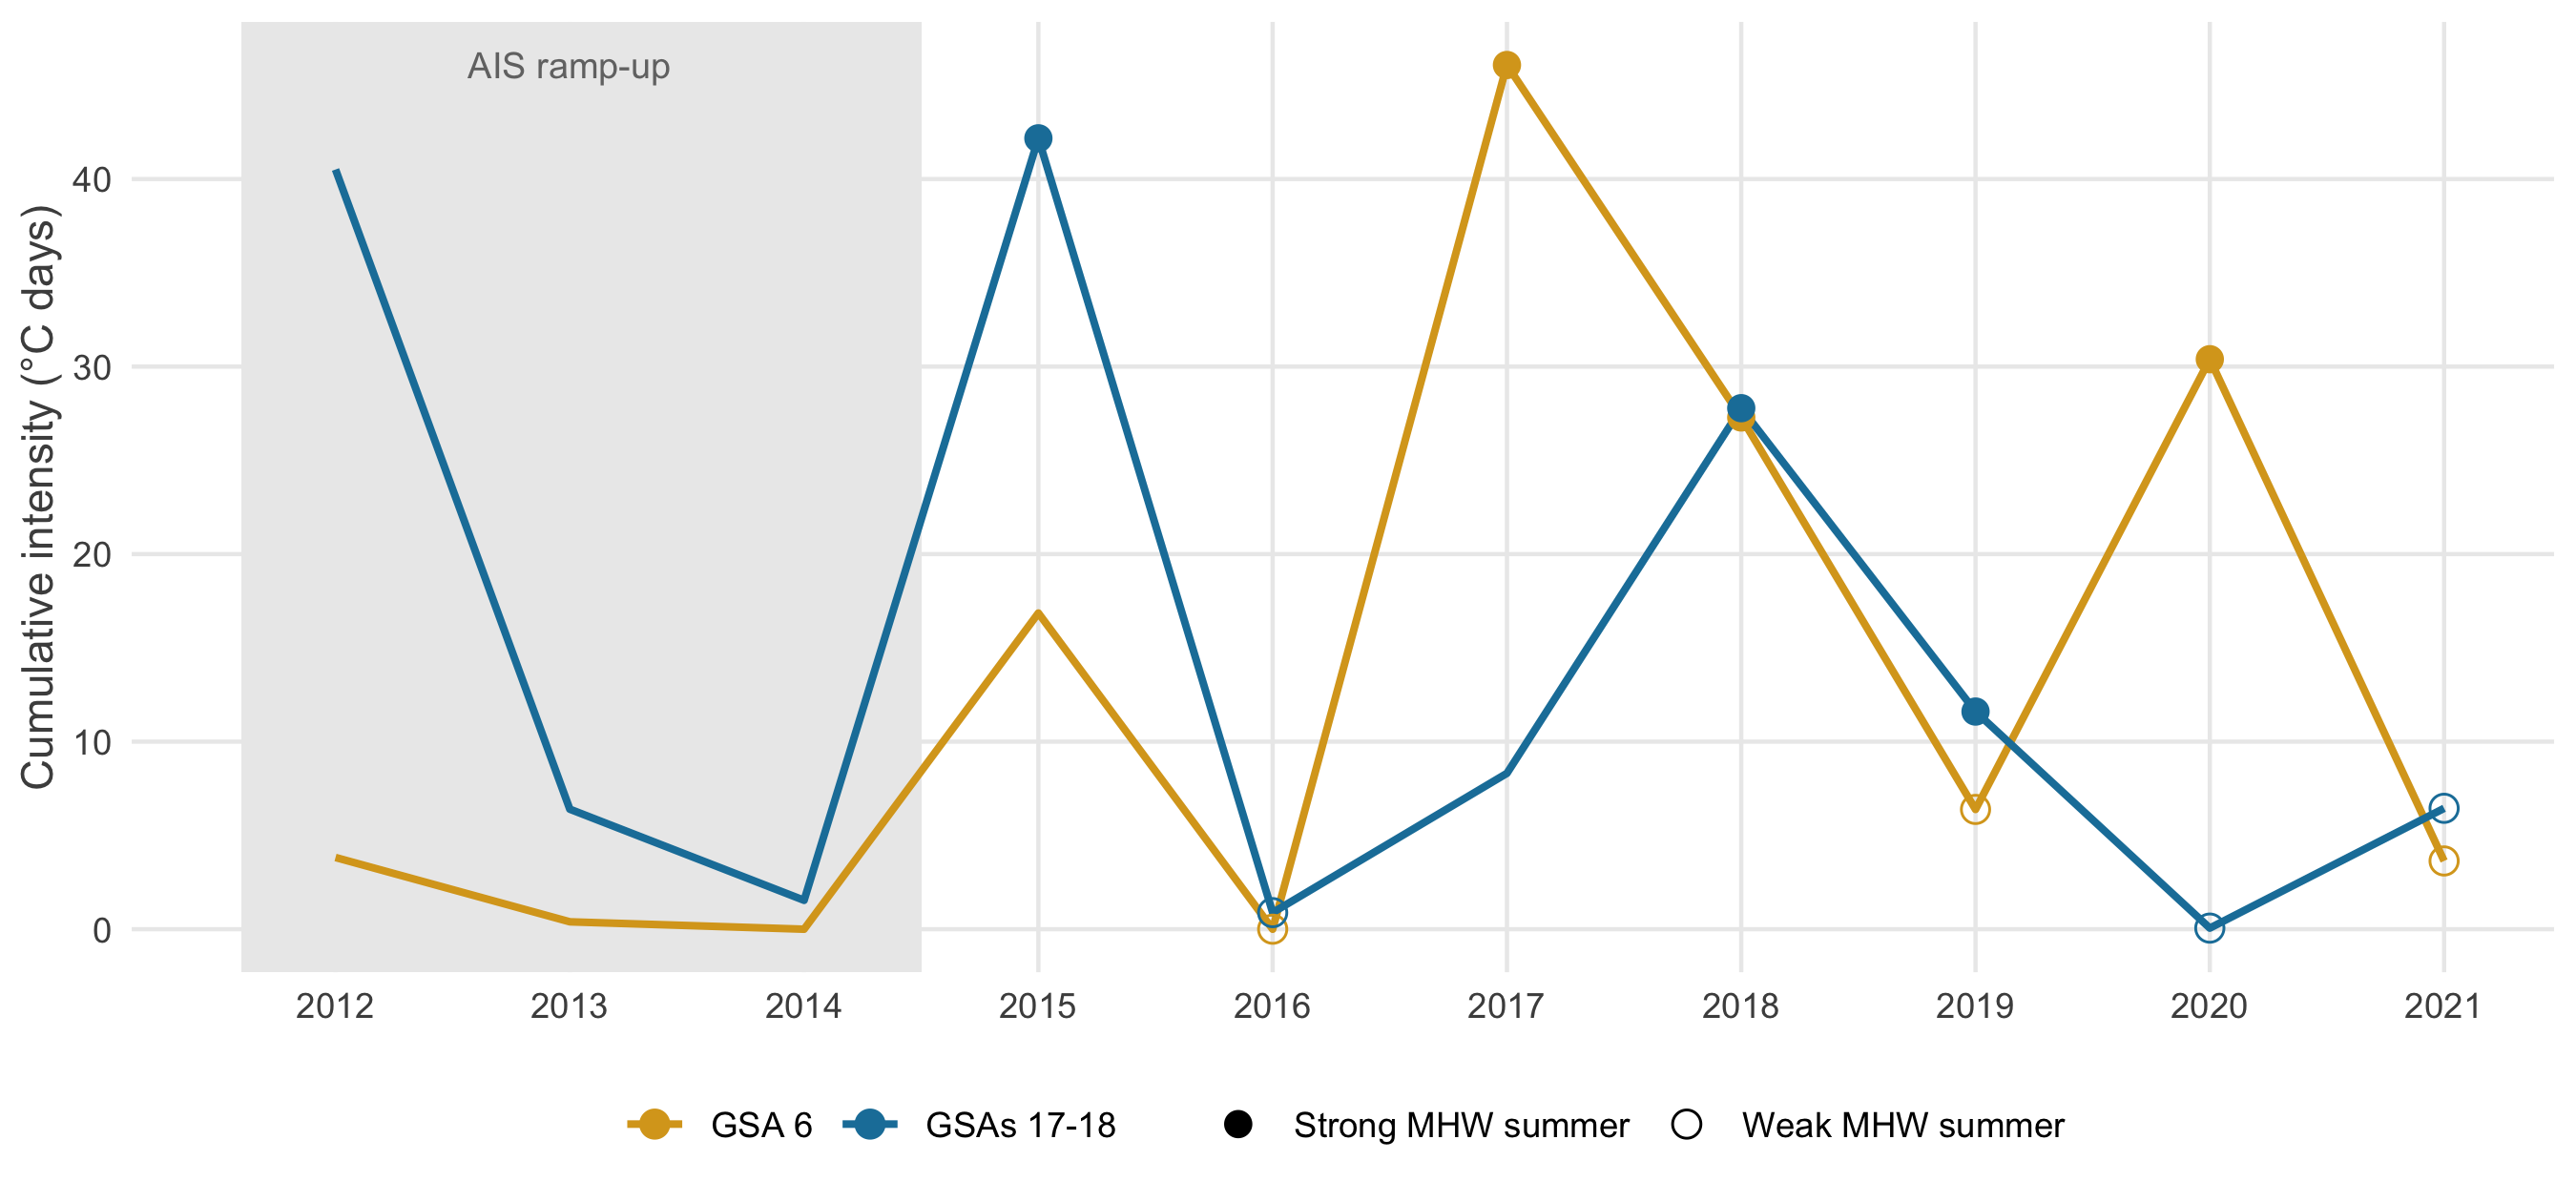
Summer heatwaves (Hobday et al. 2016) computed on the prediction grid of each area
- GSA 6 strongest summers: 2017, 2018, 2020
- Adriatic strongest summers: 2015, 2018, 2019
Discussion point: the two areas do not share their heatwave years (2020: strong in GSA 6, almost none in the Adriatic), so comparisons need area-specific years.
Heatwaves, biomass trends and trawling trends: GSA 6
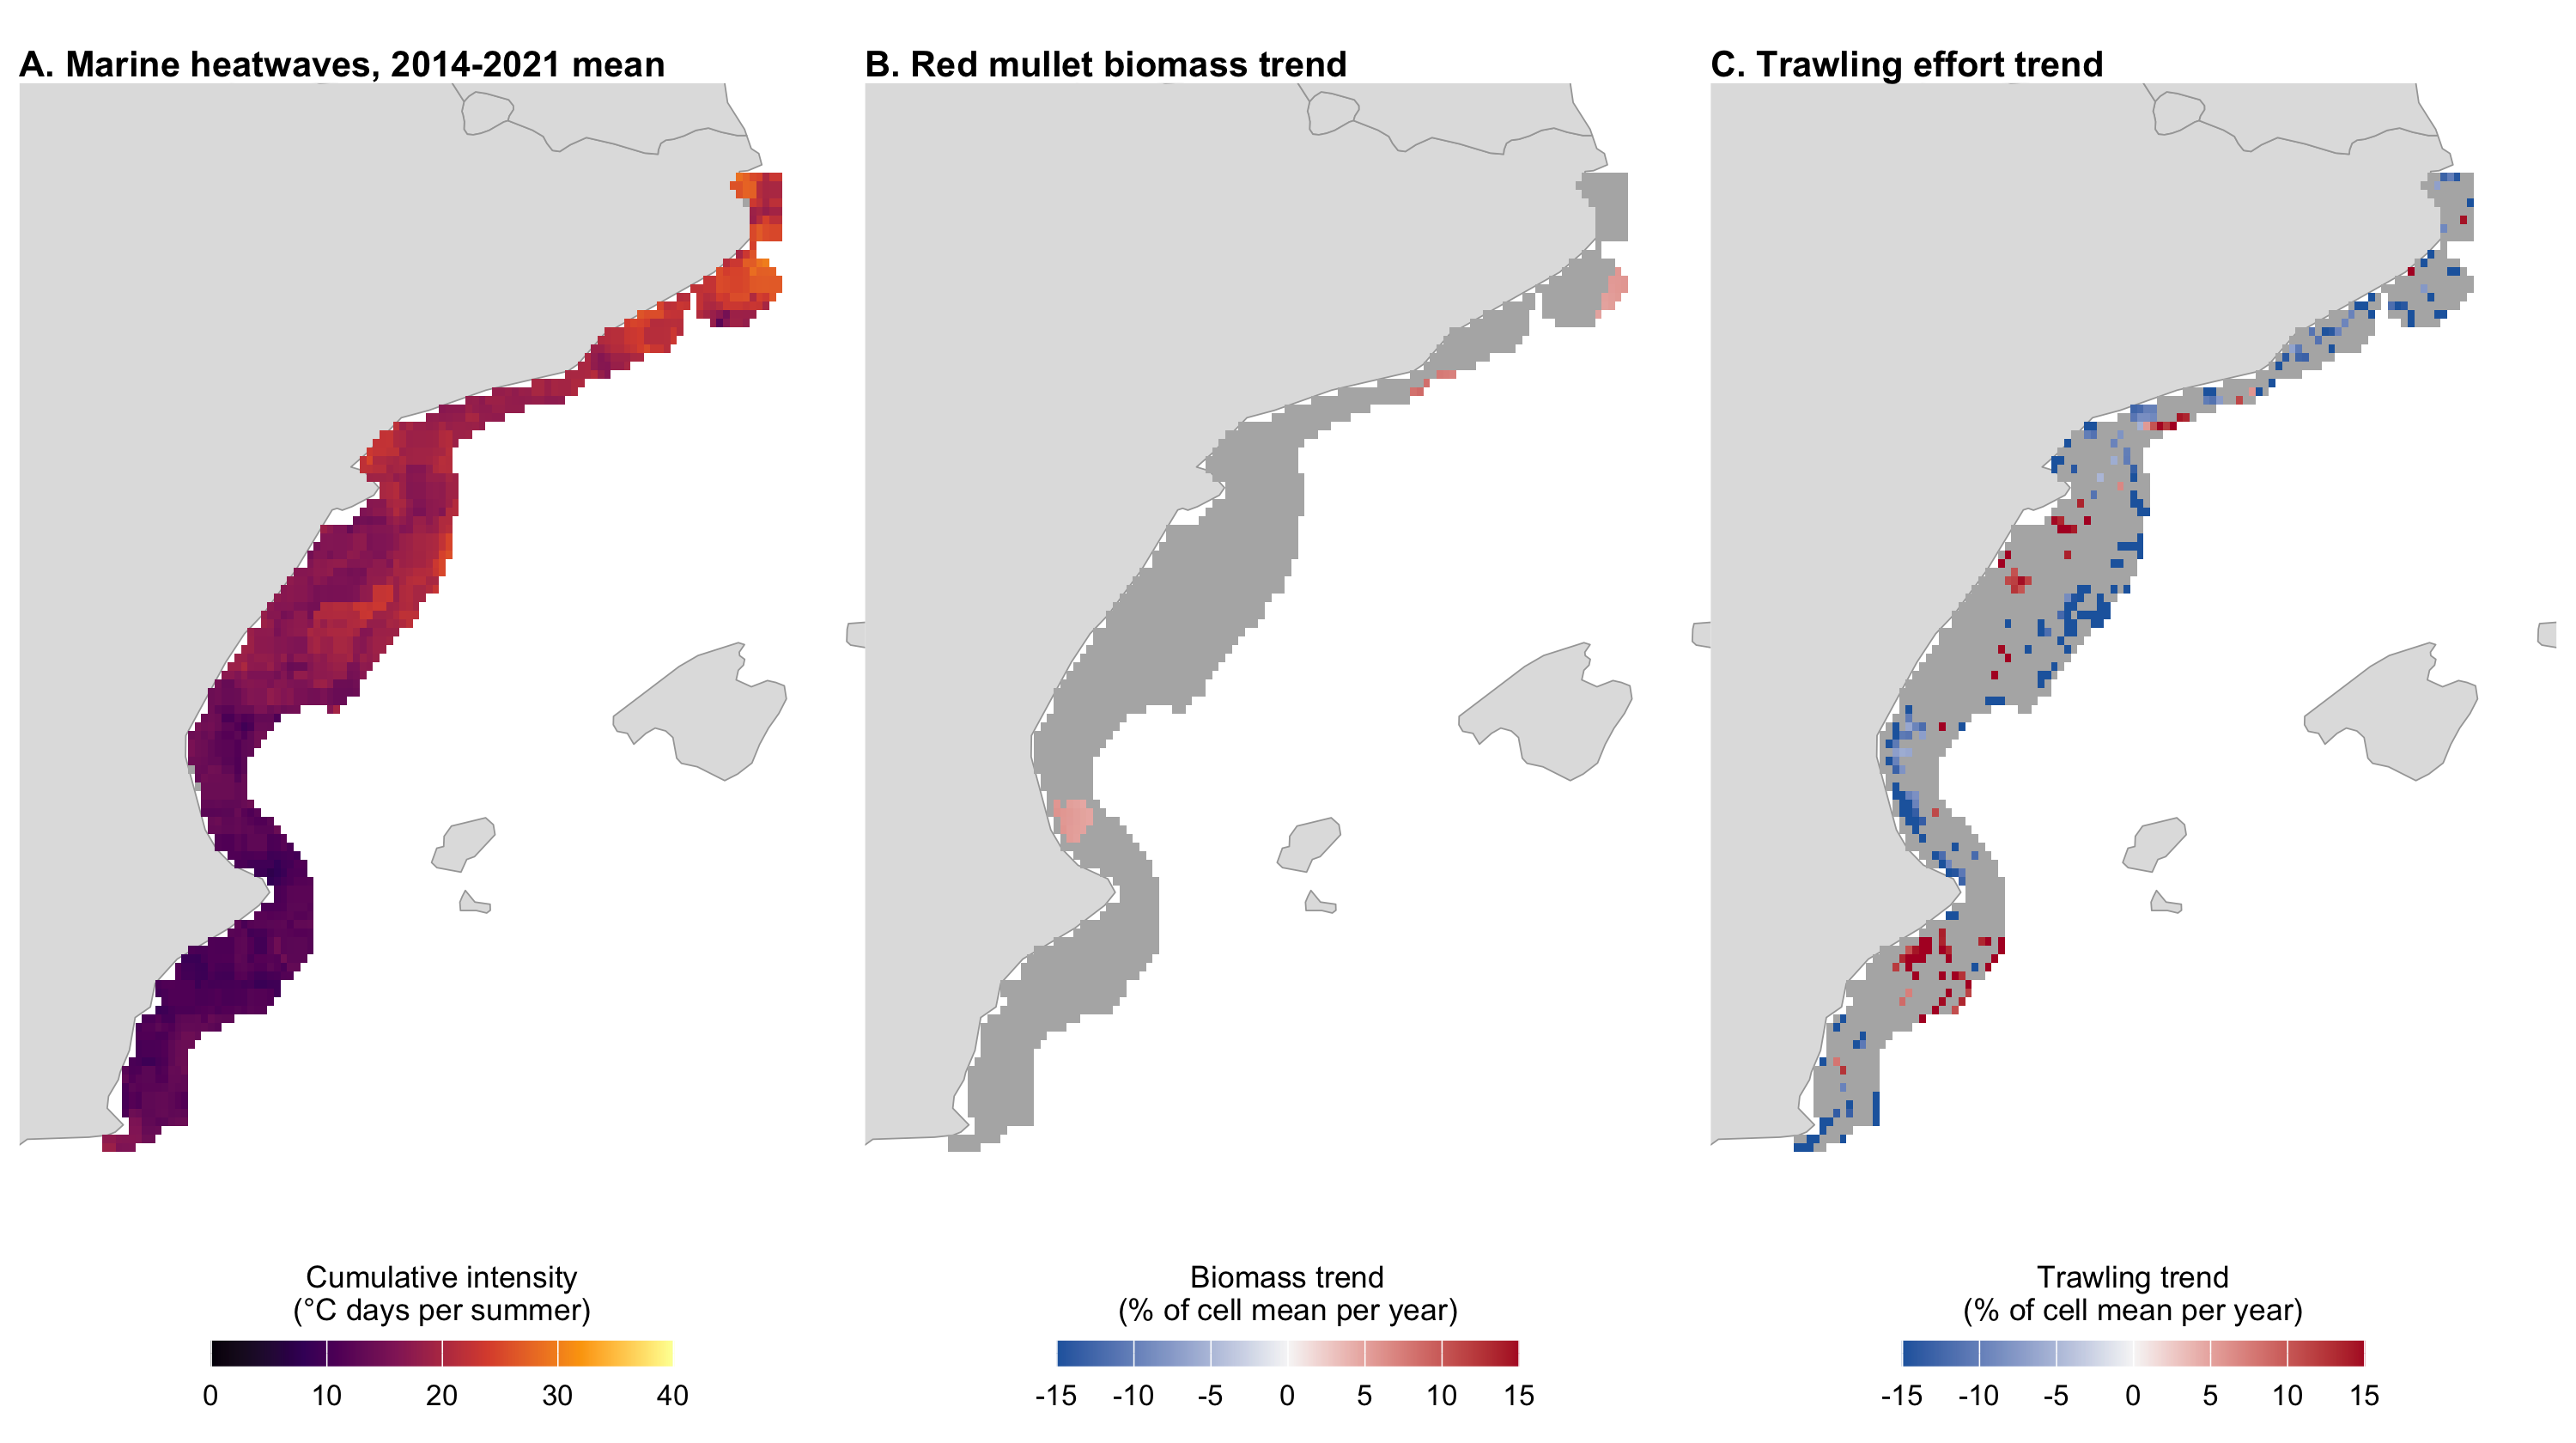
Trends 2014-2021 per cell, as % of the cell’s mean per year; grey: not significant (p ≥ 0.05). Significant biomass trends: 3% of cells; none after correcting for multiple tests.
Heatwaves, biomass trends and trawling trends: Adriatic
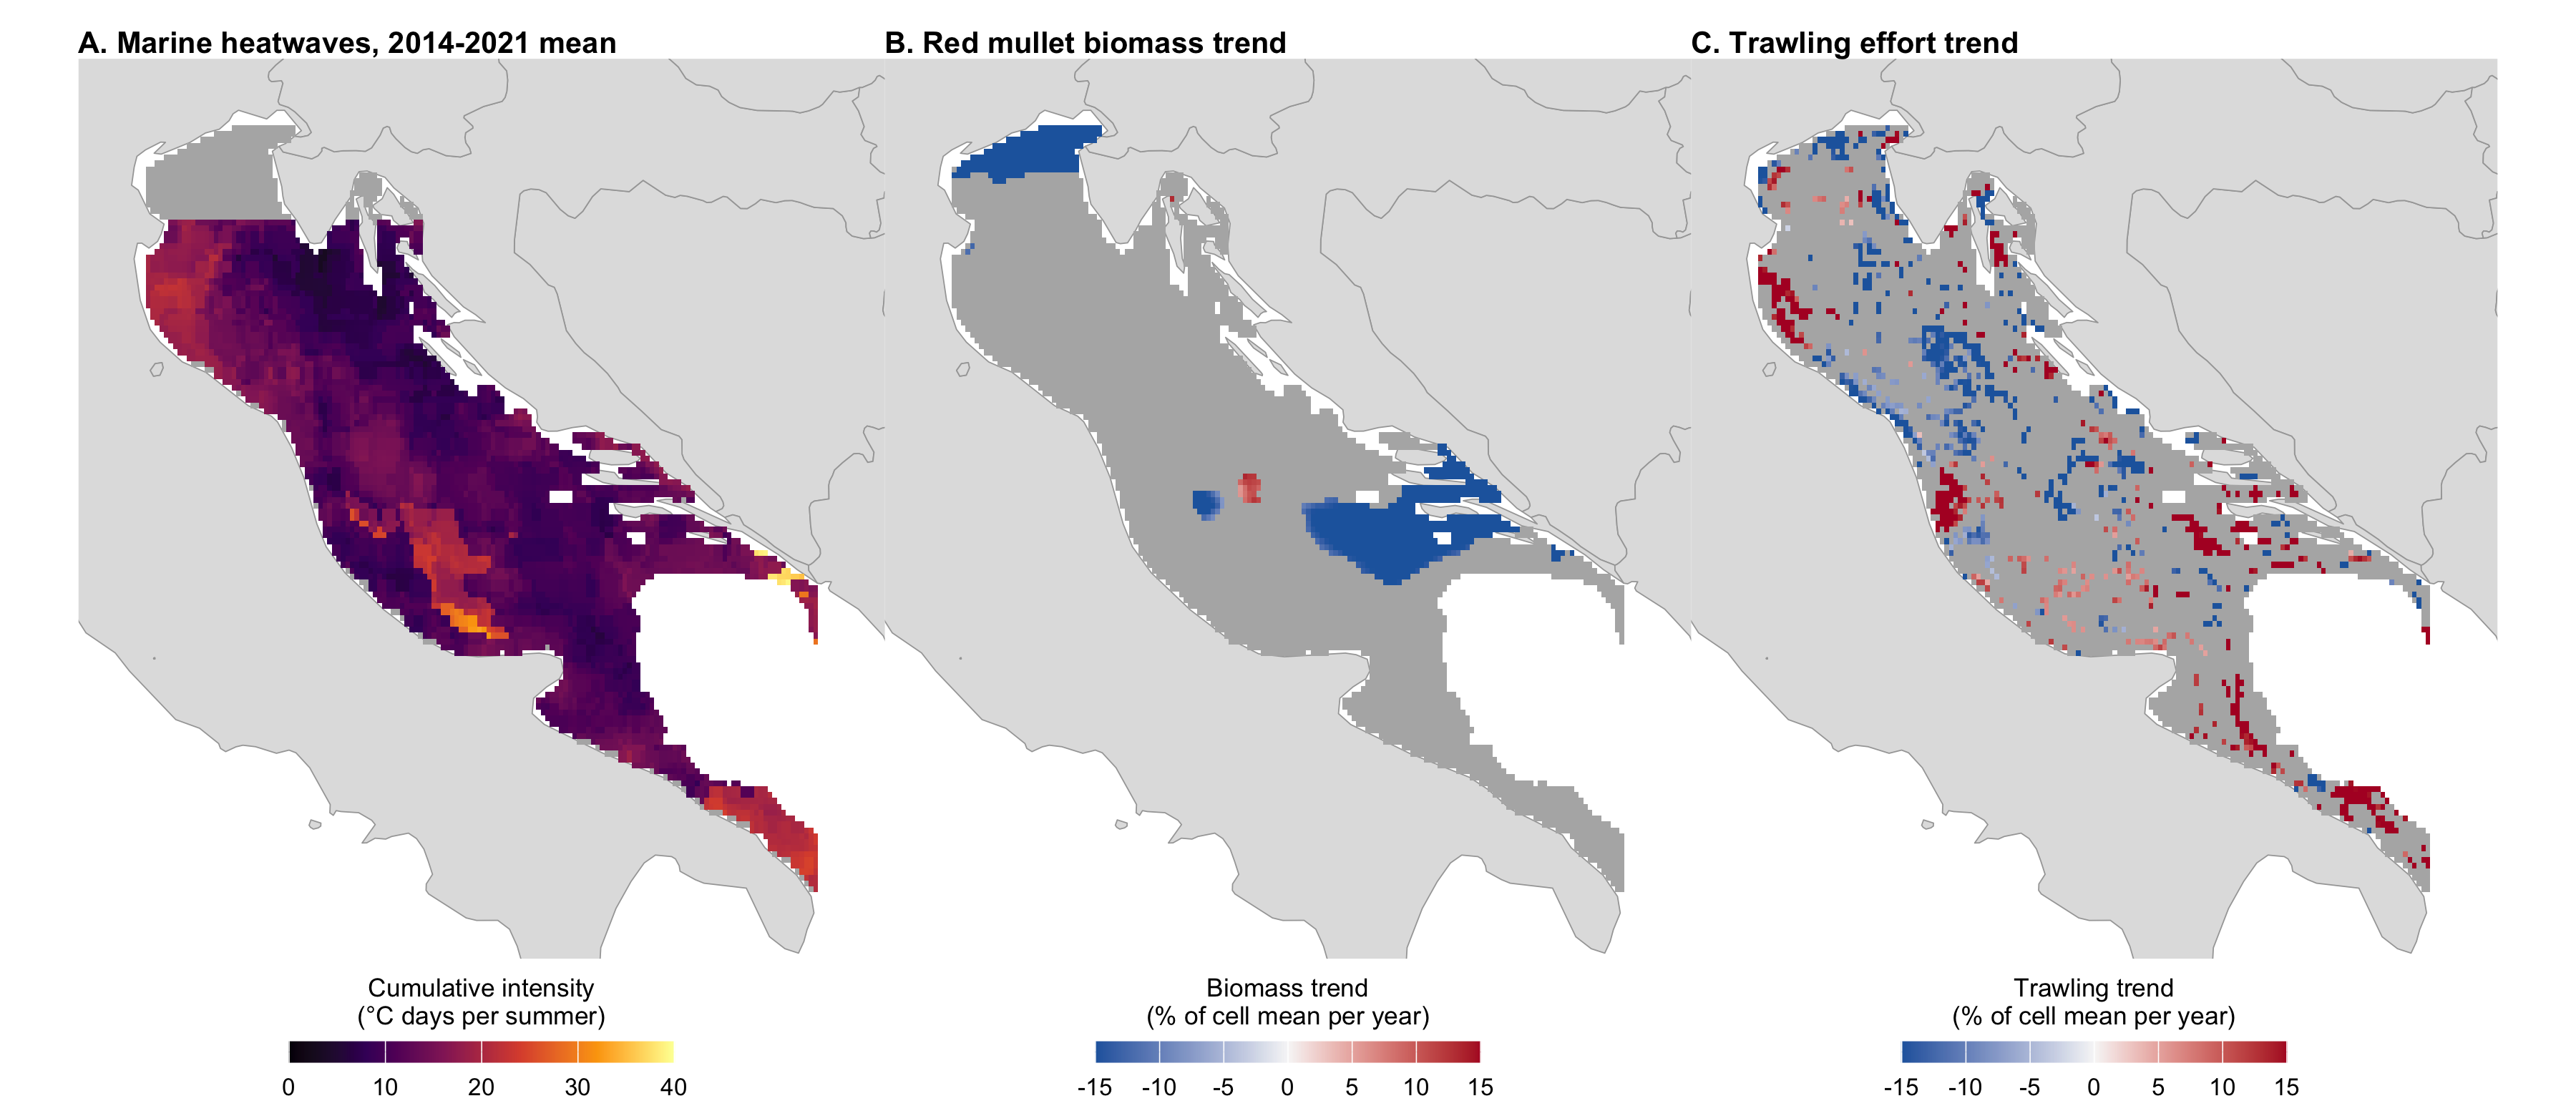
Grey in A: no SST data north of 45°N. Significant biomass trends: 12% of cells; none after correcting for multiple tests.
Trawling in strong and weak heatwave summers
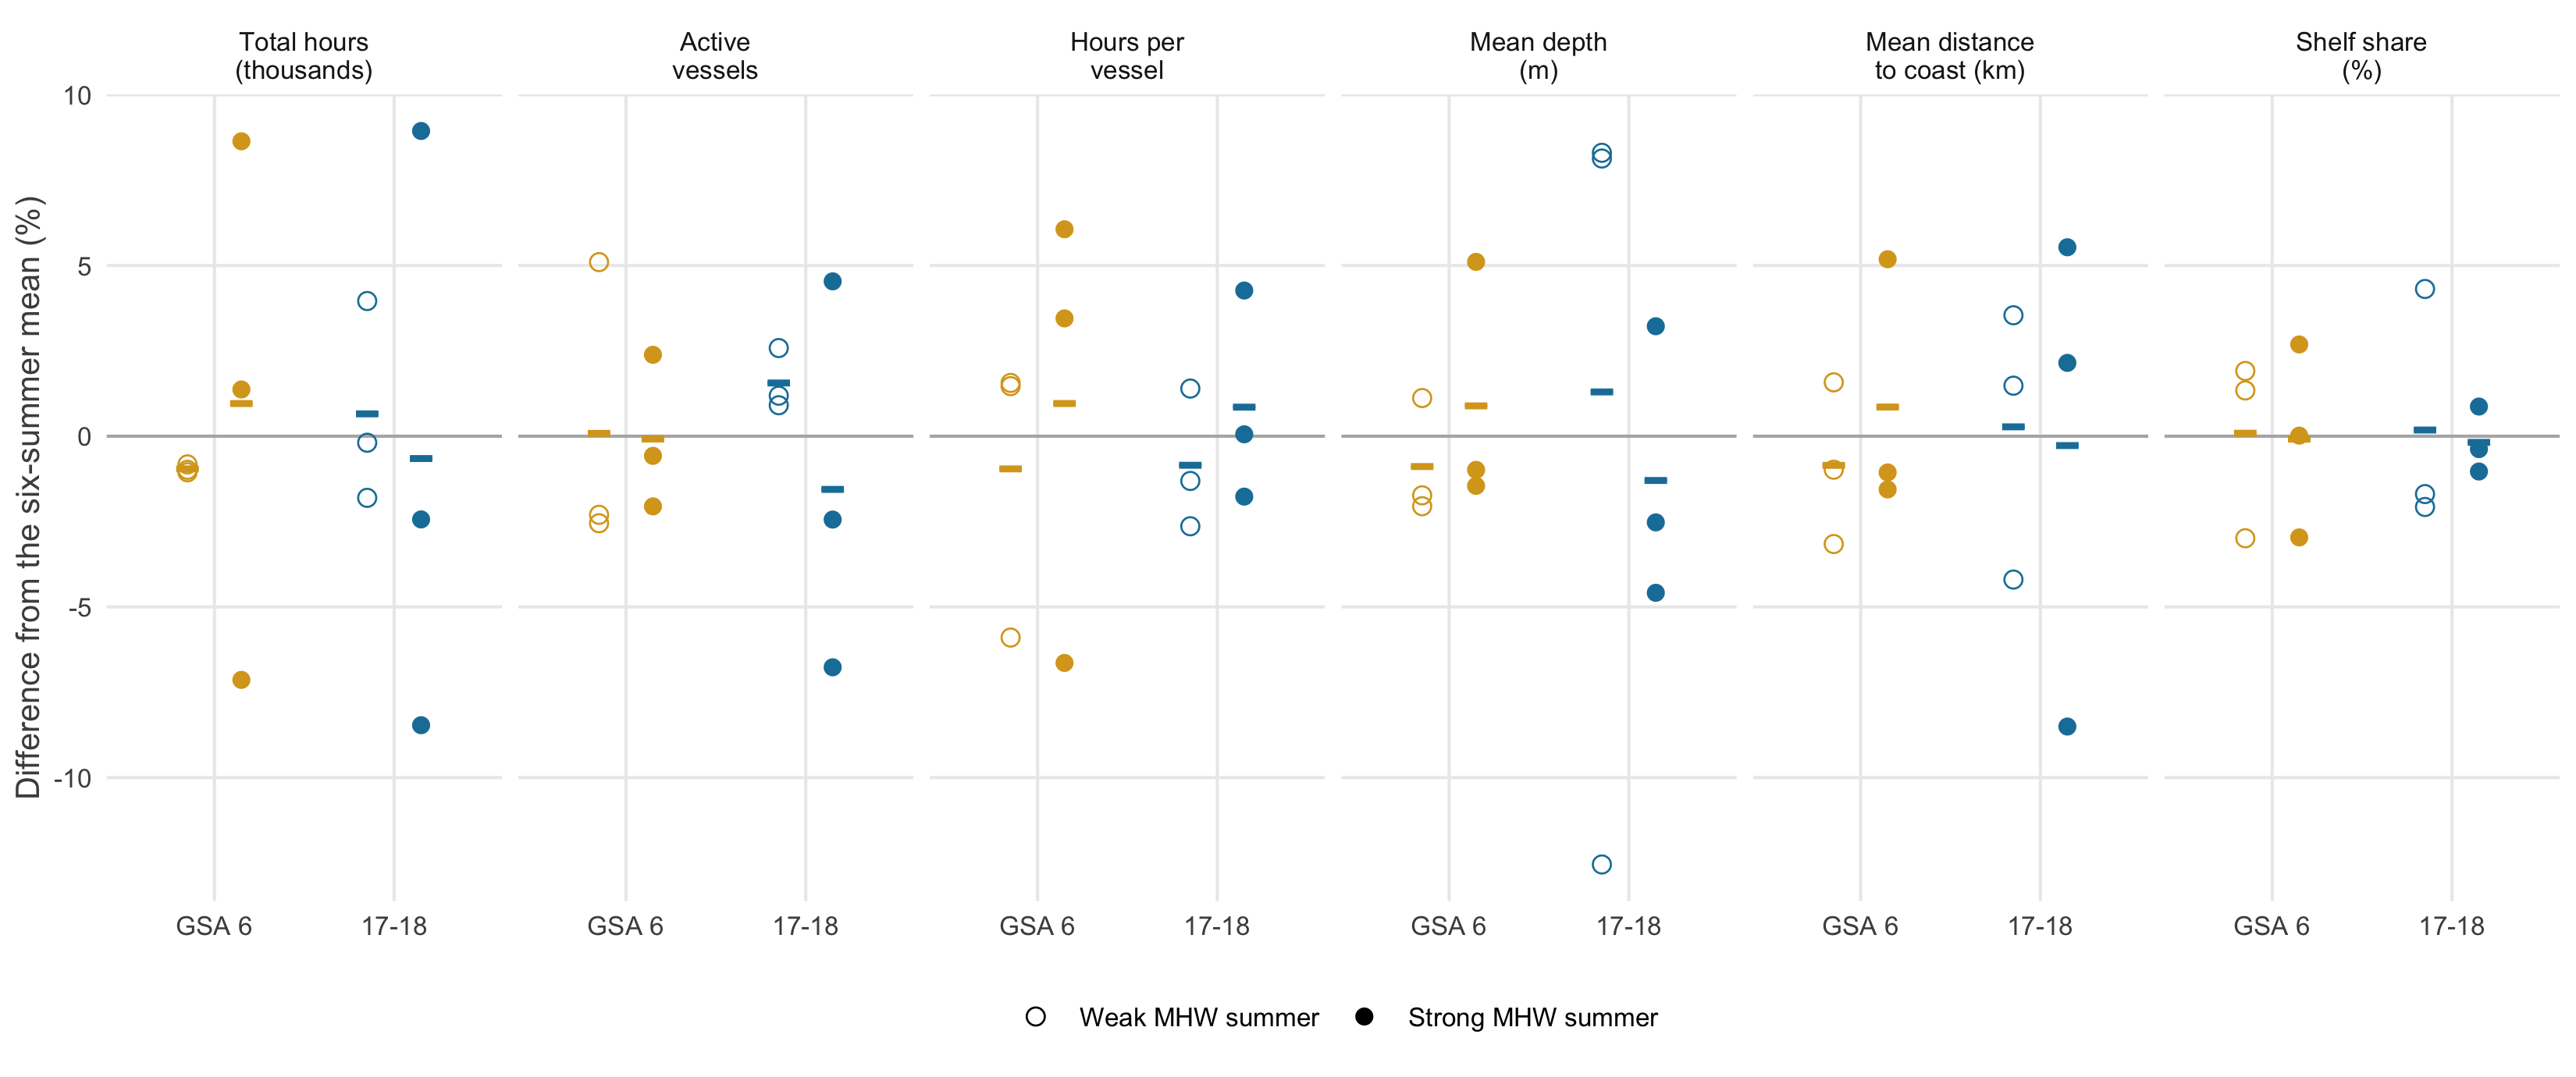
- Daily GFW trawler effort, June-August, 3 strong vs 3 weak summers, from 2015
- Total hours: +1.9% in GSA 6, -1.3% in the Adriatic, within year-to-year noise
Do the fleets fish the same grounds?
Core grounds (cells with 80% of hours): blue-grey in both types of summer, red strong only, dark blue weak only.
| GSA 6 | Adriatic | |
|---|---|---|
| Overlap D, strong vs weak | 0.72 | 0.72 |
| Overlap D, same type | 0.71, 0.7 | 0.71, 0.72 |
| Centre shift | 1.4 km | 3.9 km |
| Effort on red mullet hotspots | 13% / 14% | 23% / 20% |
Same grounds in strong and weak heatwave summers: overlap as high as between two summers of the same type (D: 1 = identical effort distribution).
Heatwaves and red mullet biomass across years
Adriatic: biomass drops in the two strongest heatwave summers (2015, 2018), recovers the year after; overall ρ = -0.14
GSA 6: the opposite, its strongest heatwave summers are among its higher-biomass years (ρ = 0.53)
Discussion point: eight years per area, two areas in opposite directions: a hypothesis to test, not a result.
Heatwaves and red mullet biomass within years
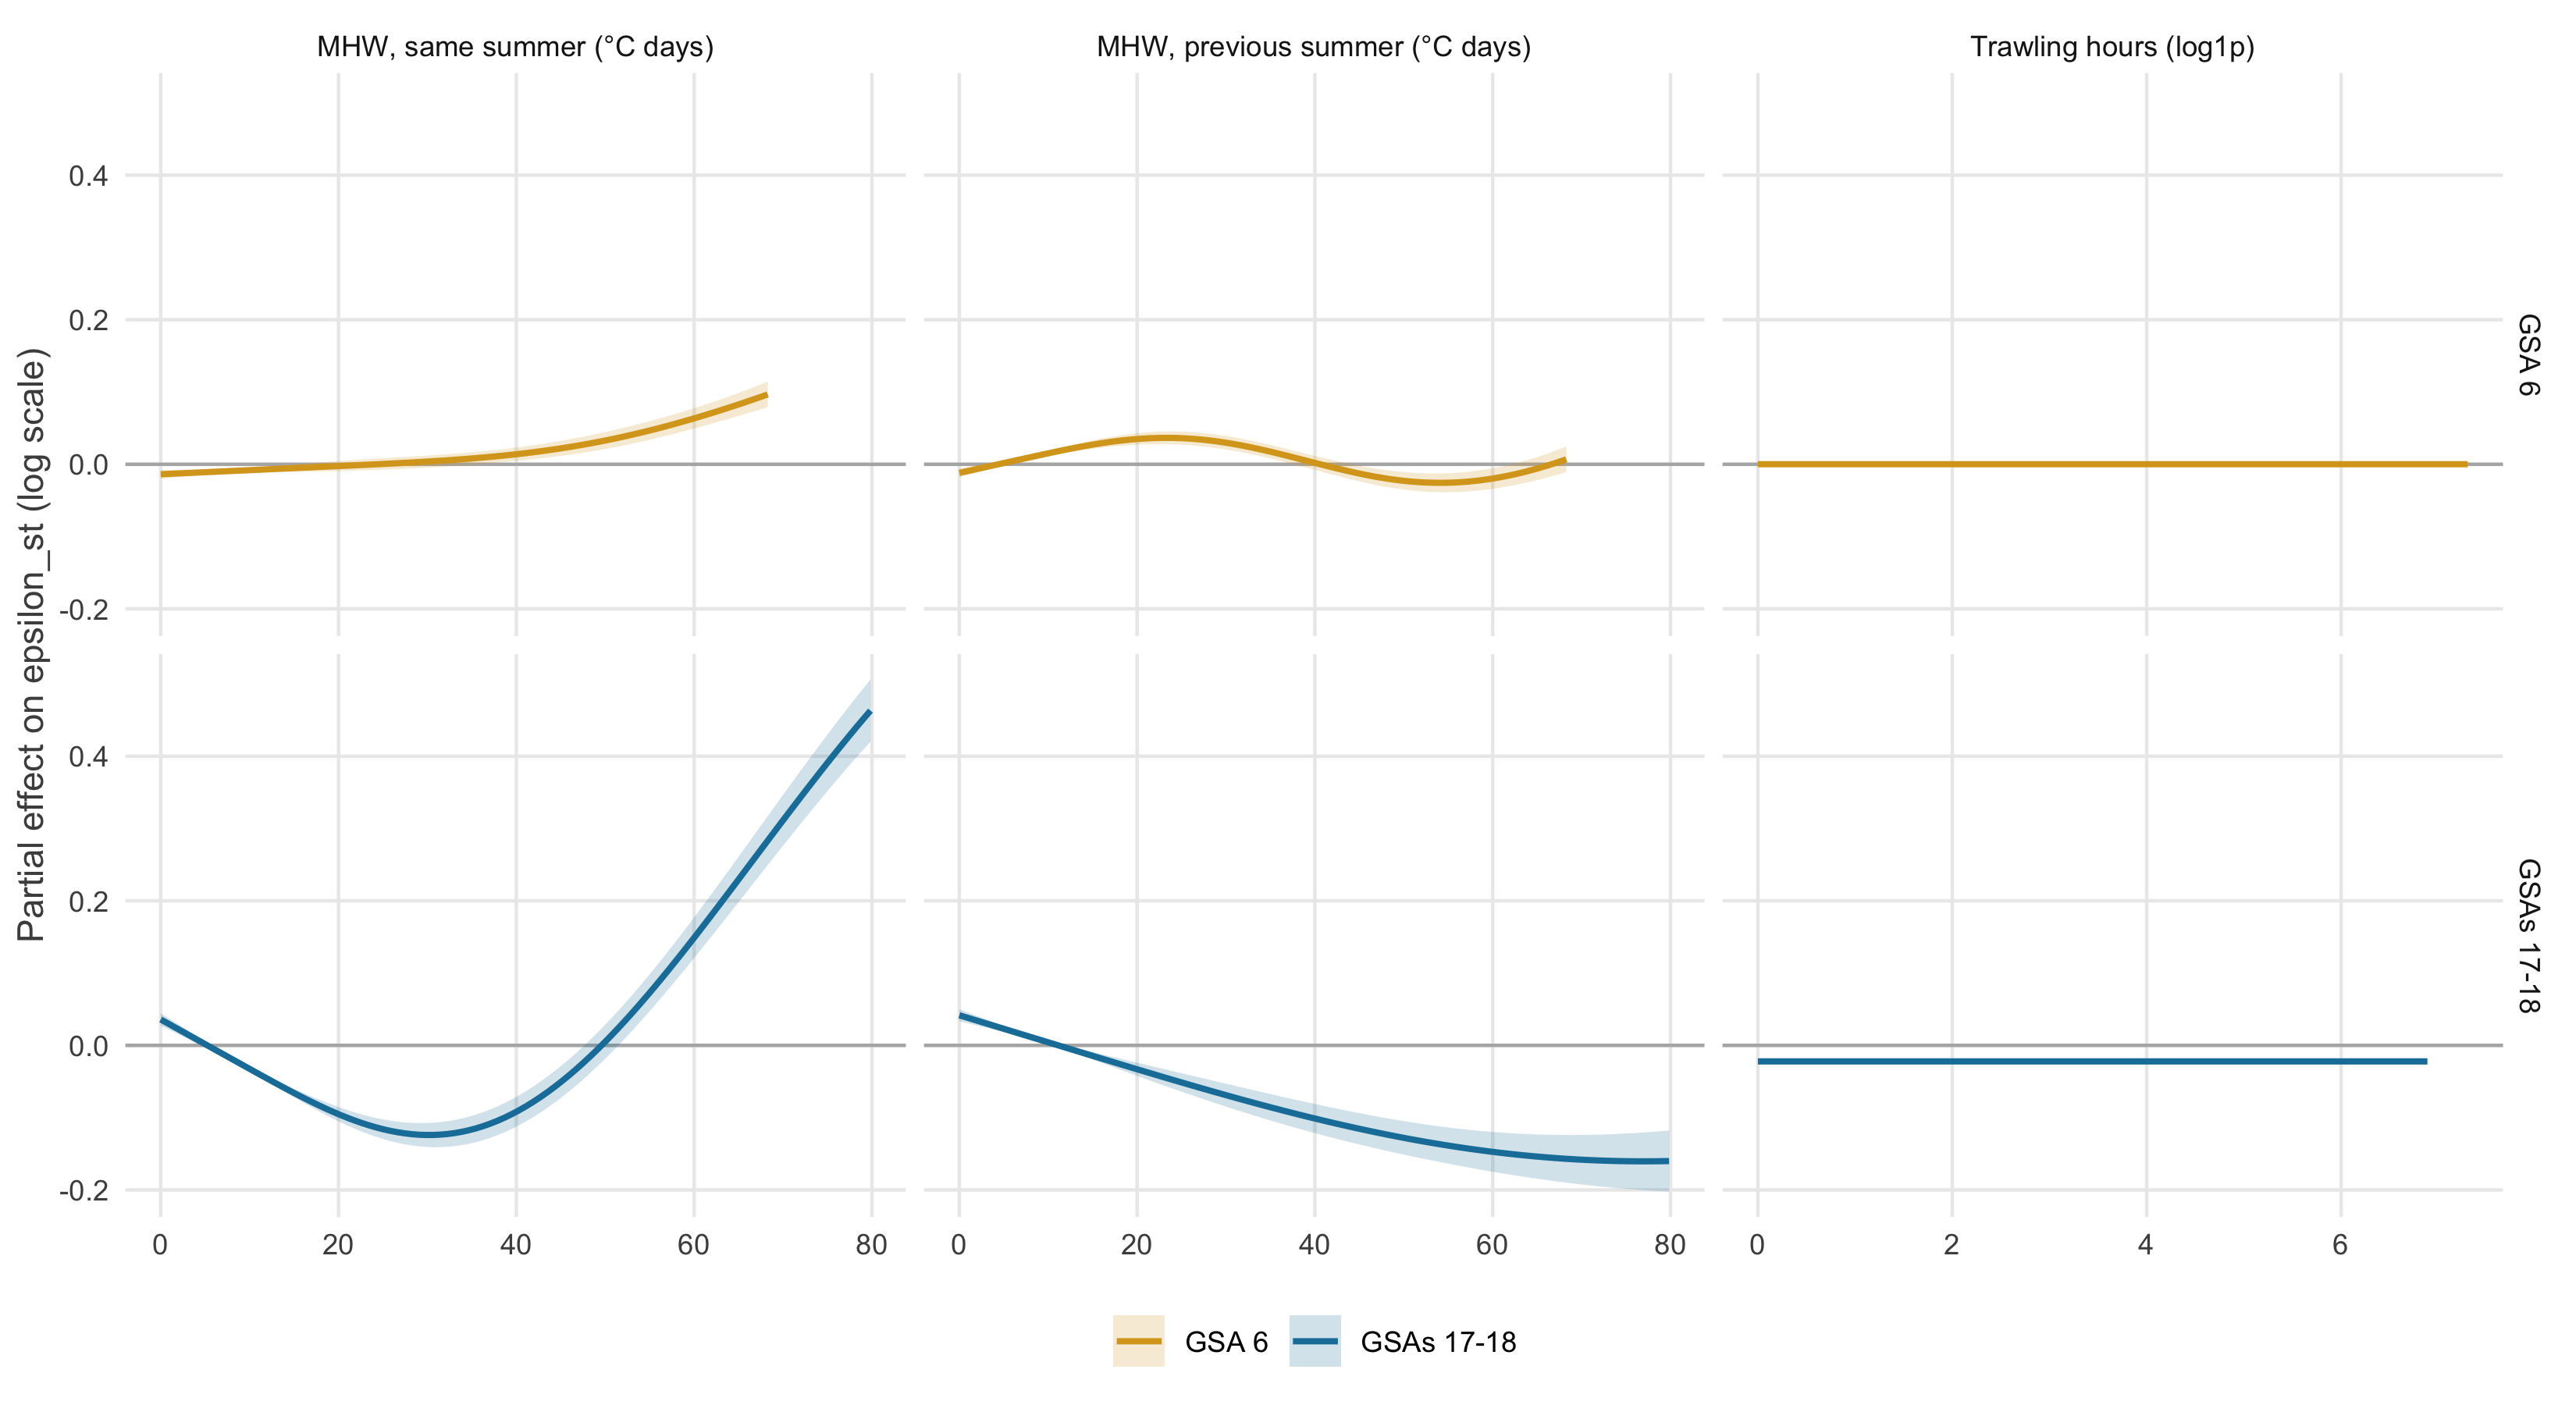
Year-specific deviation of predicted biomass (ε) in each cell, against heatwaves and trawling, with depth, latitude and year in the model
- GSA 6: small effects
- Adriatic: not monotonic, a dip at moderate heat, higher biomass in the hottest cells
- No trawling effect in either area
- Does not reproduce the annual dips
Marine heatwaves and fleet behaviour
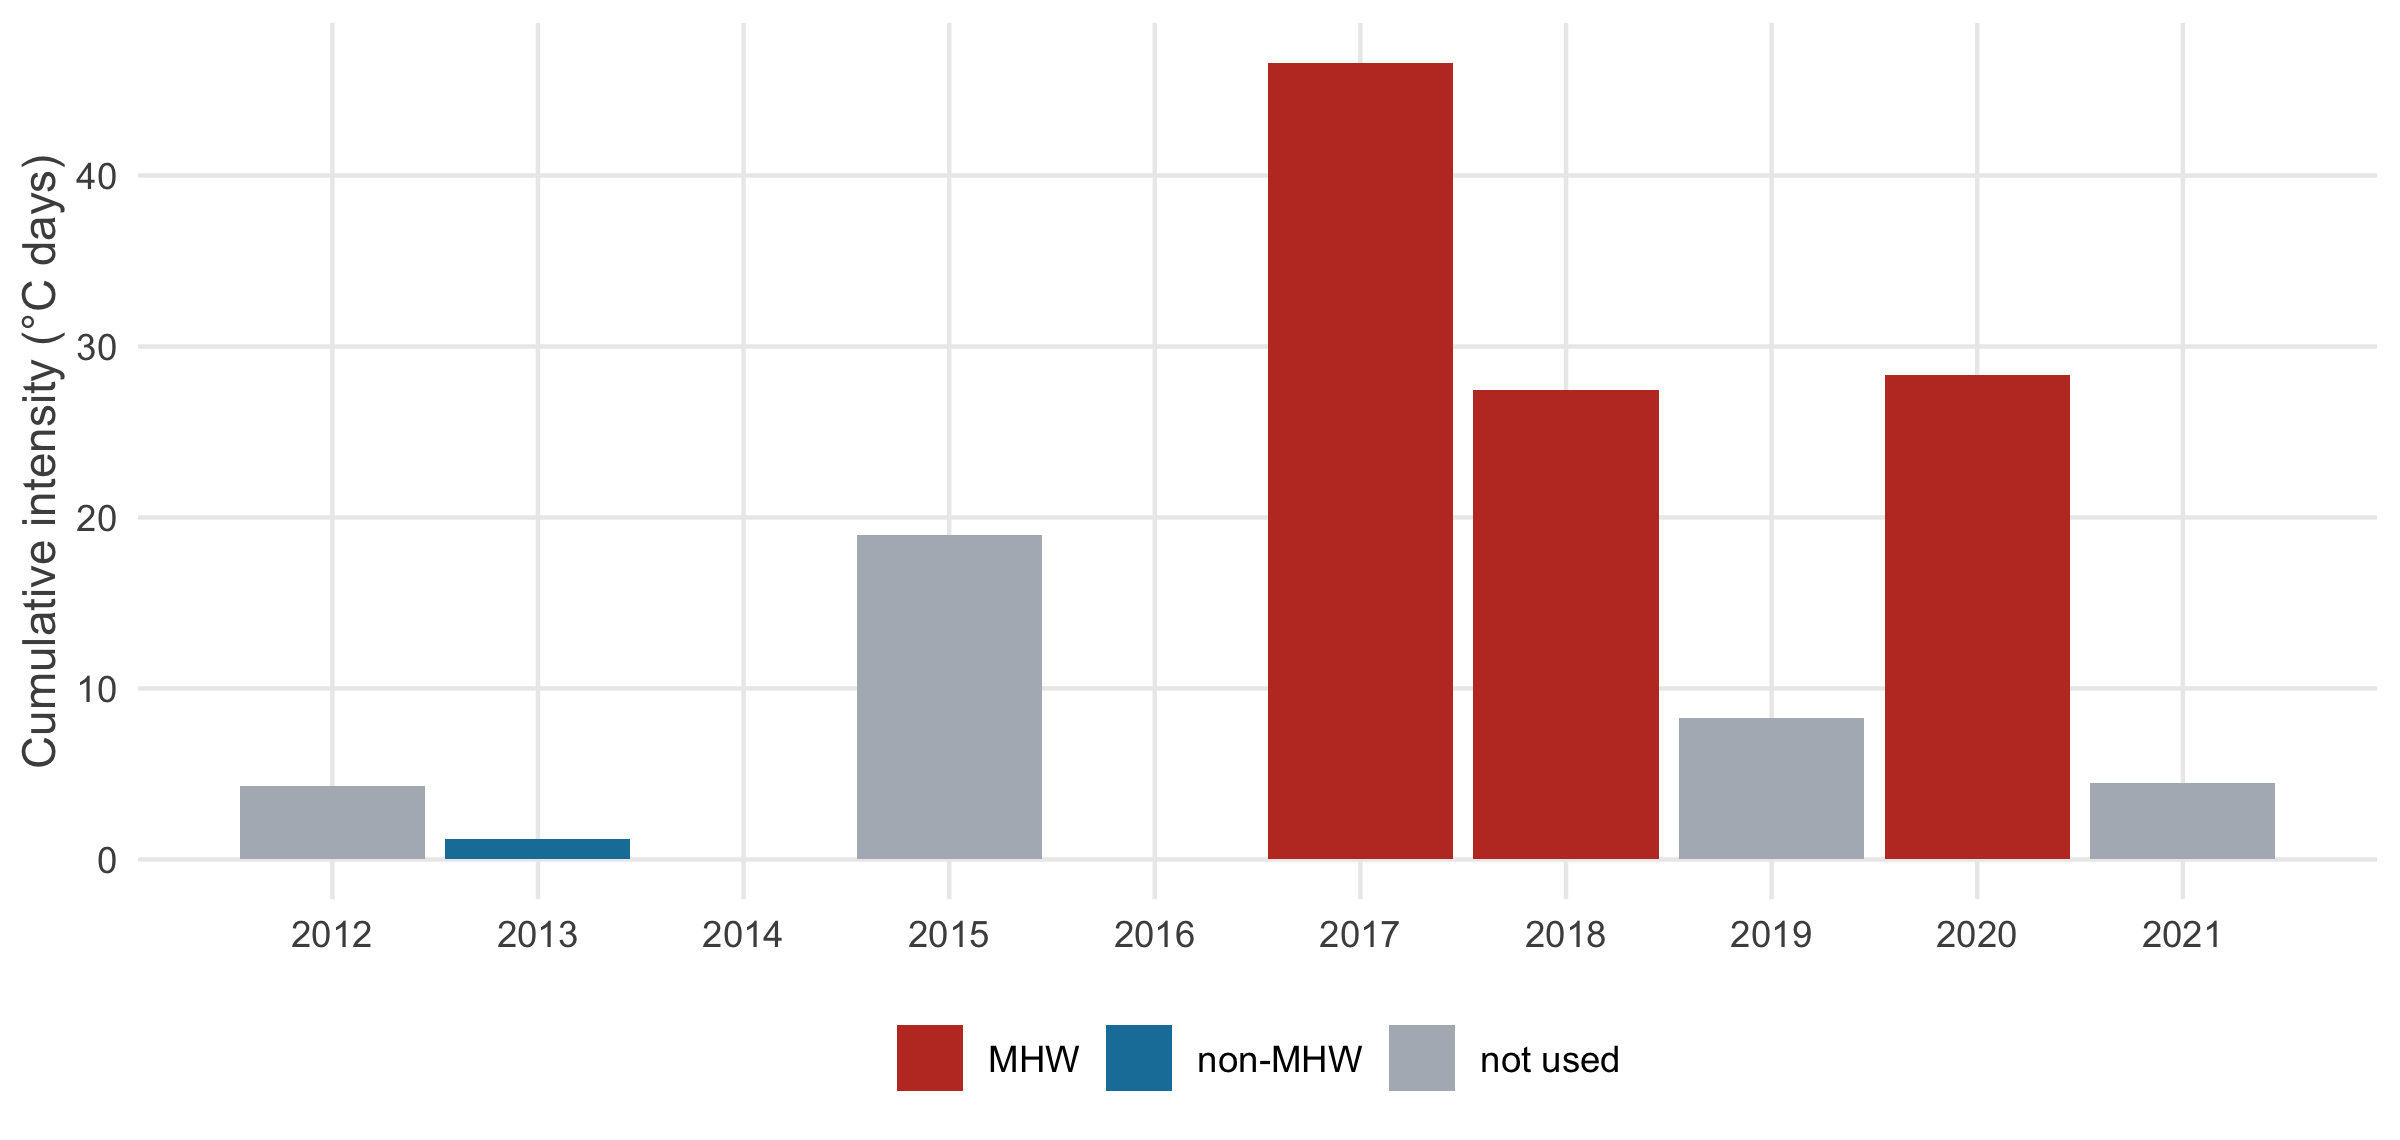
- Hobday et al. (2016) detection with
heatwaveR, summer events only - Strongest summers: 2017 (46.6 °C·days), 2020, 2018; none in 2014 and 2016
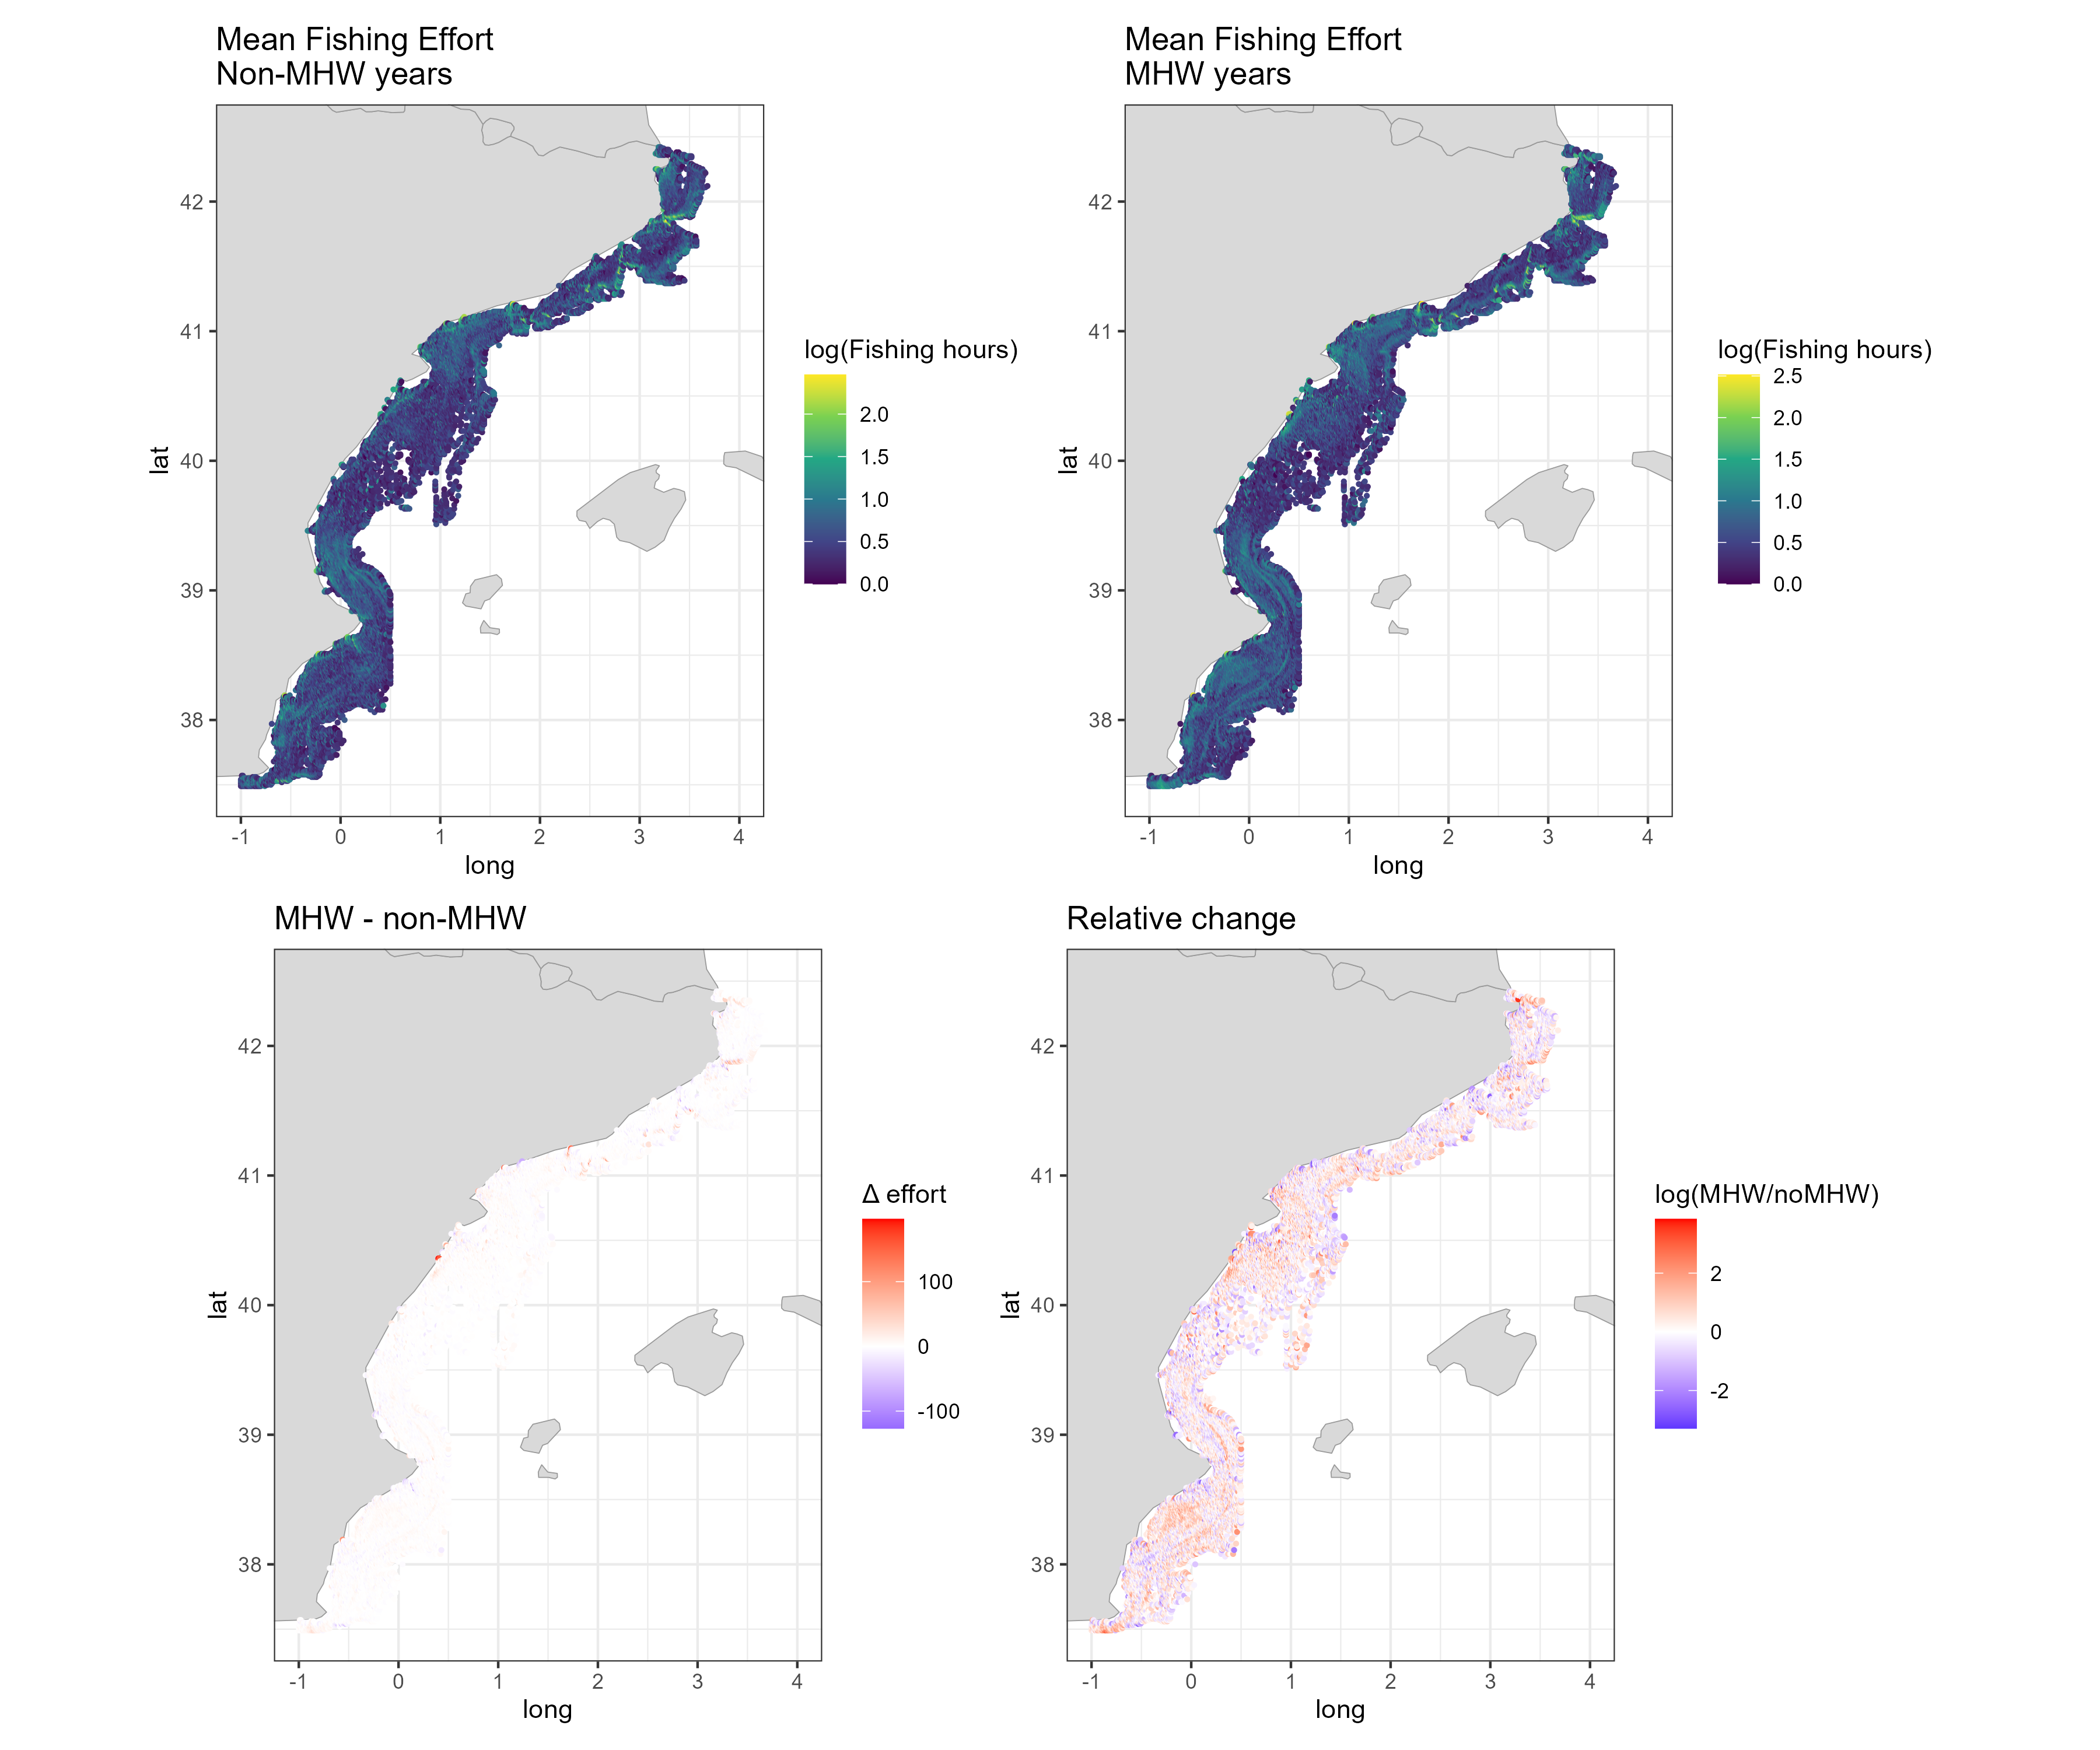
56% of cells show more trawling in heatwave summers, but non-heatwave years include low-AIS 2013-2014. Contrast 2016 vs 2017 instead.
Climate-fisheries vulnerability index
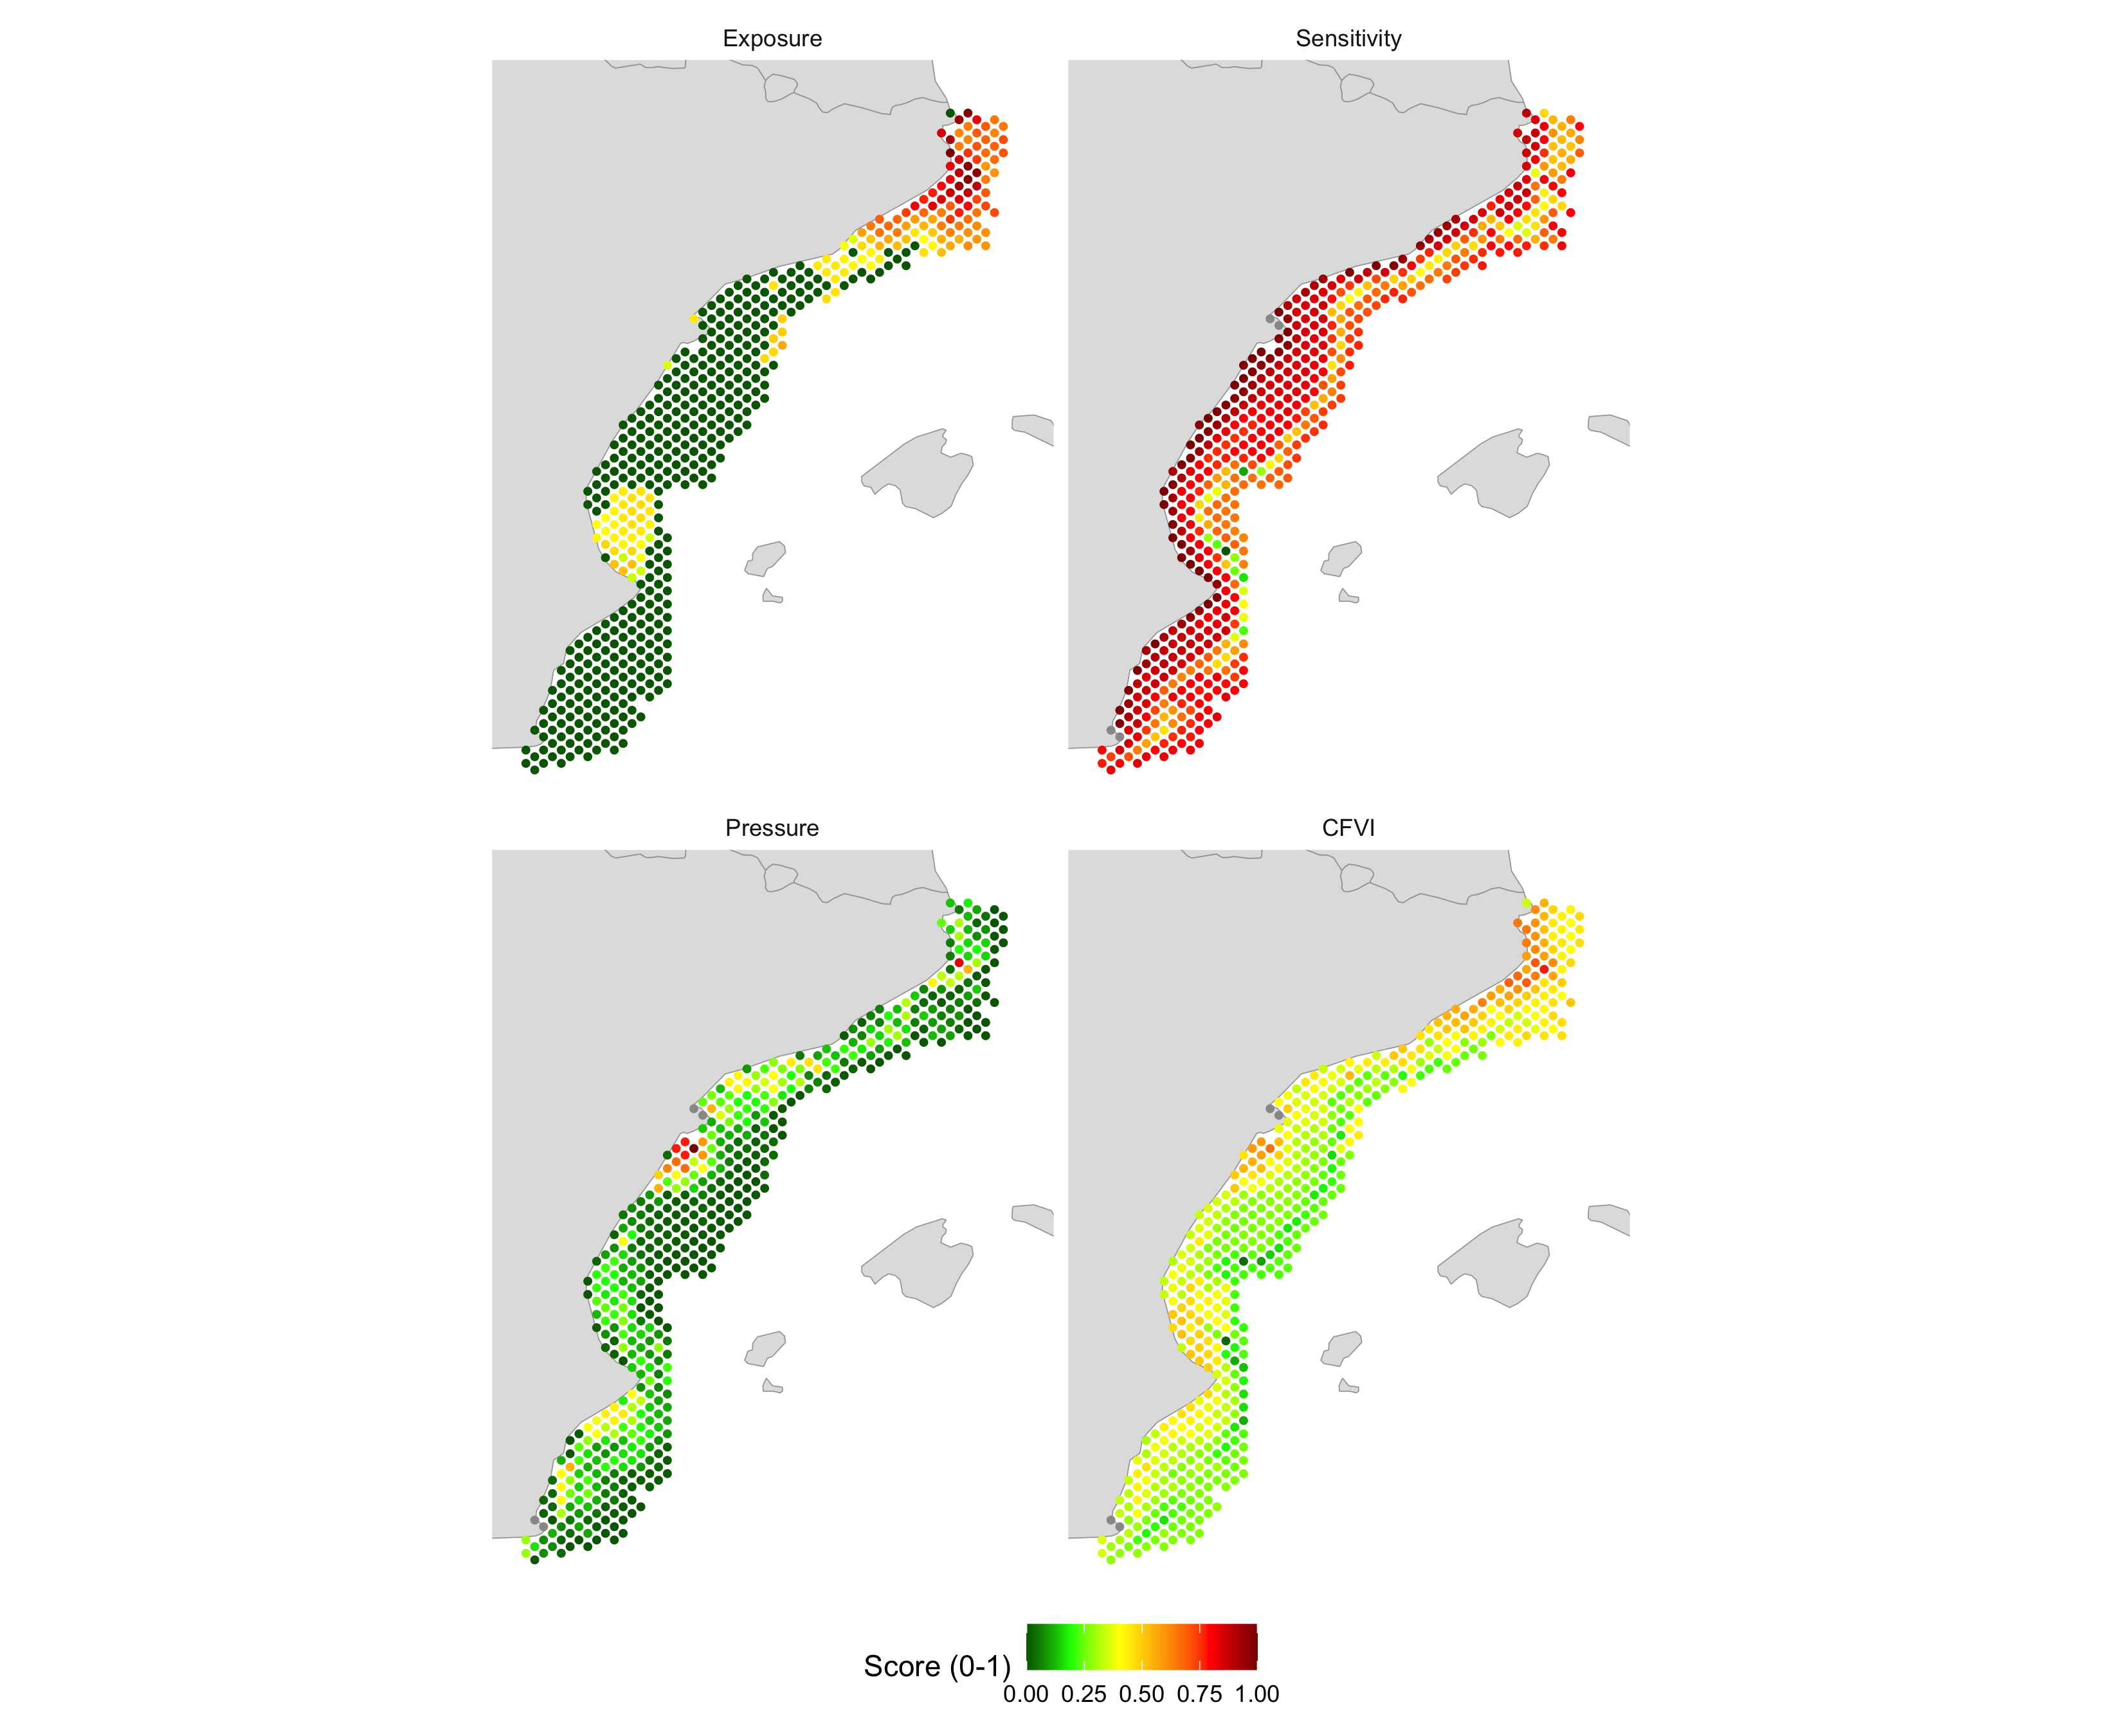
Mean of three 0-1 scores: heatwave exposure + habitat loss + fishing pressure
- Hotspots off Cap de Creus-Roses and nearshore off the Ebro and Valencia
- Exposure from 2021 only: 71% of cells score exactly 0
- Pressure very skewed: median score 0.08
Better: 2015-2021 mean exposure, log effort, test the weights
AIS coverage changes over time
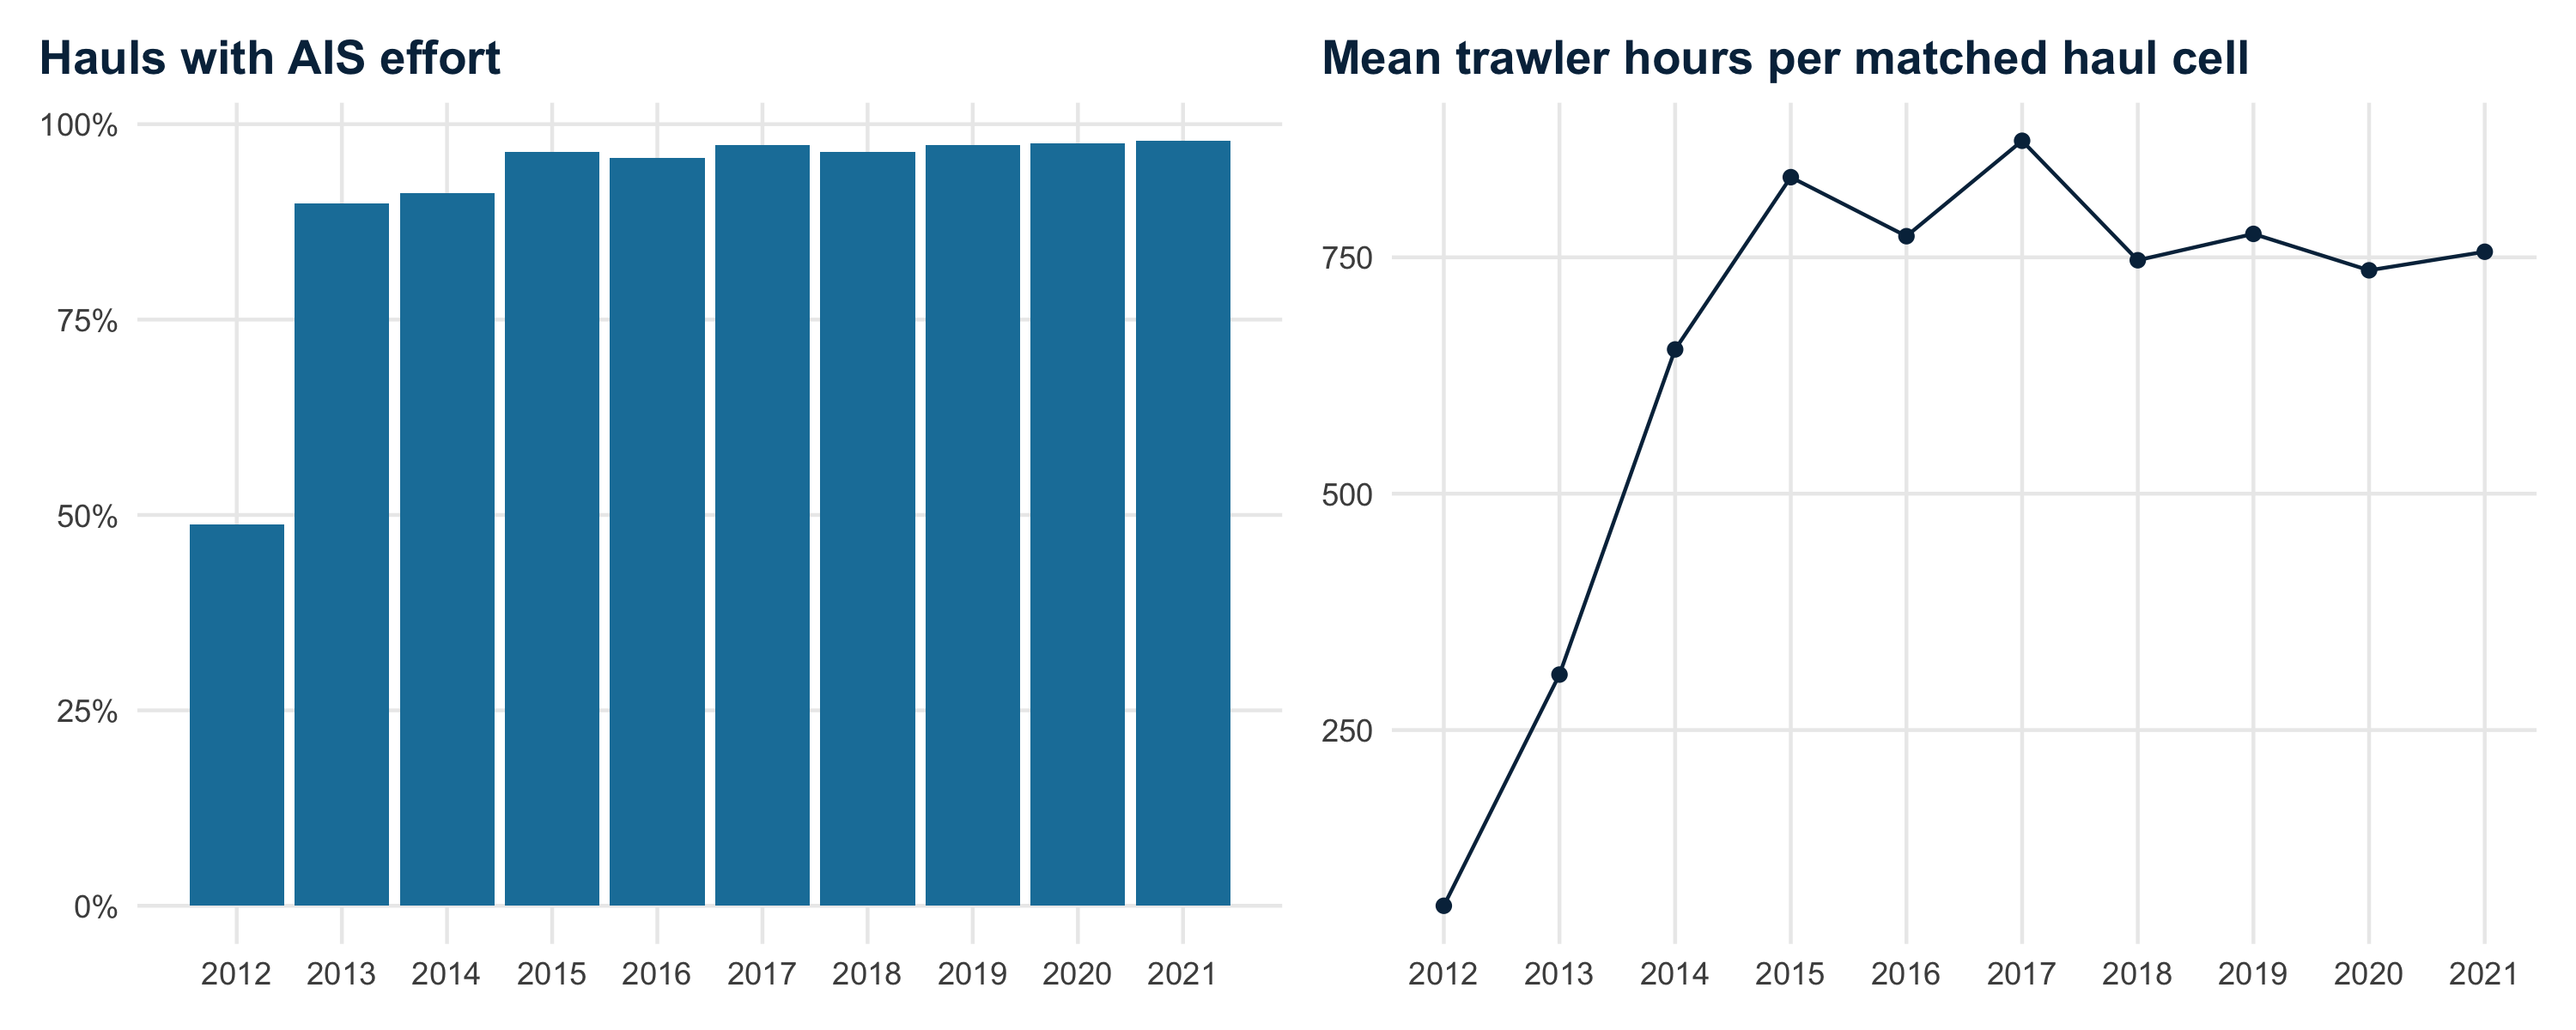
49% → 98% hauls with matched AIS effort, 2012 → 2021
64 → 835 h mean effort at matched hauls, 2012 → 2015
The 2012-2014 rise reflects AIS adoption, not more fishing. Comparisons spanning these years partly measure AIS uptake: start in 2015 or use effort per vessel.
Collinearity among predictors
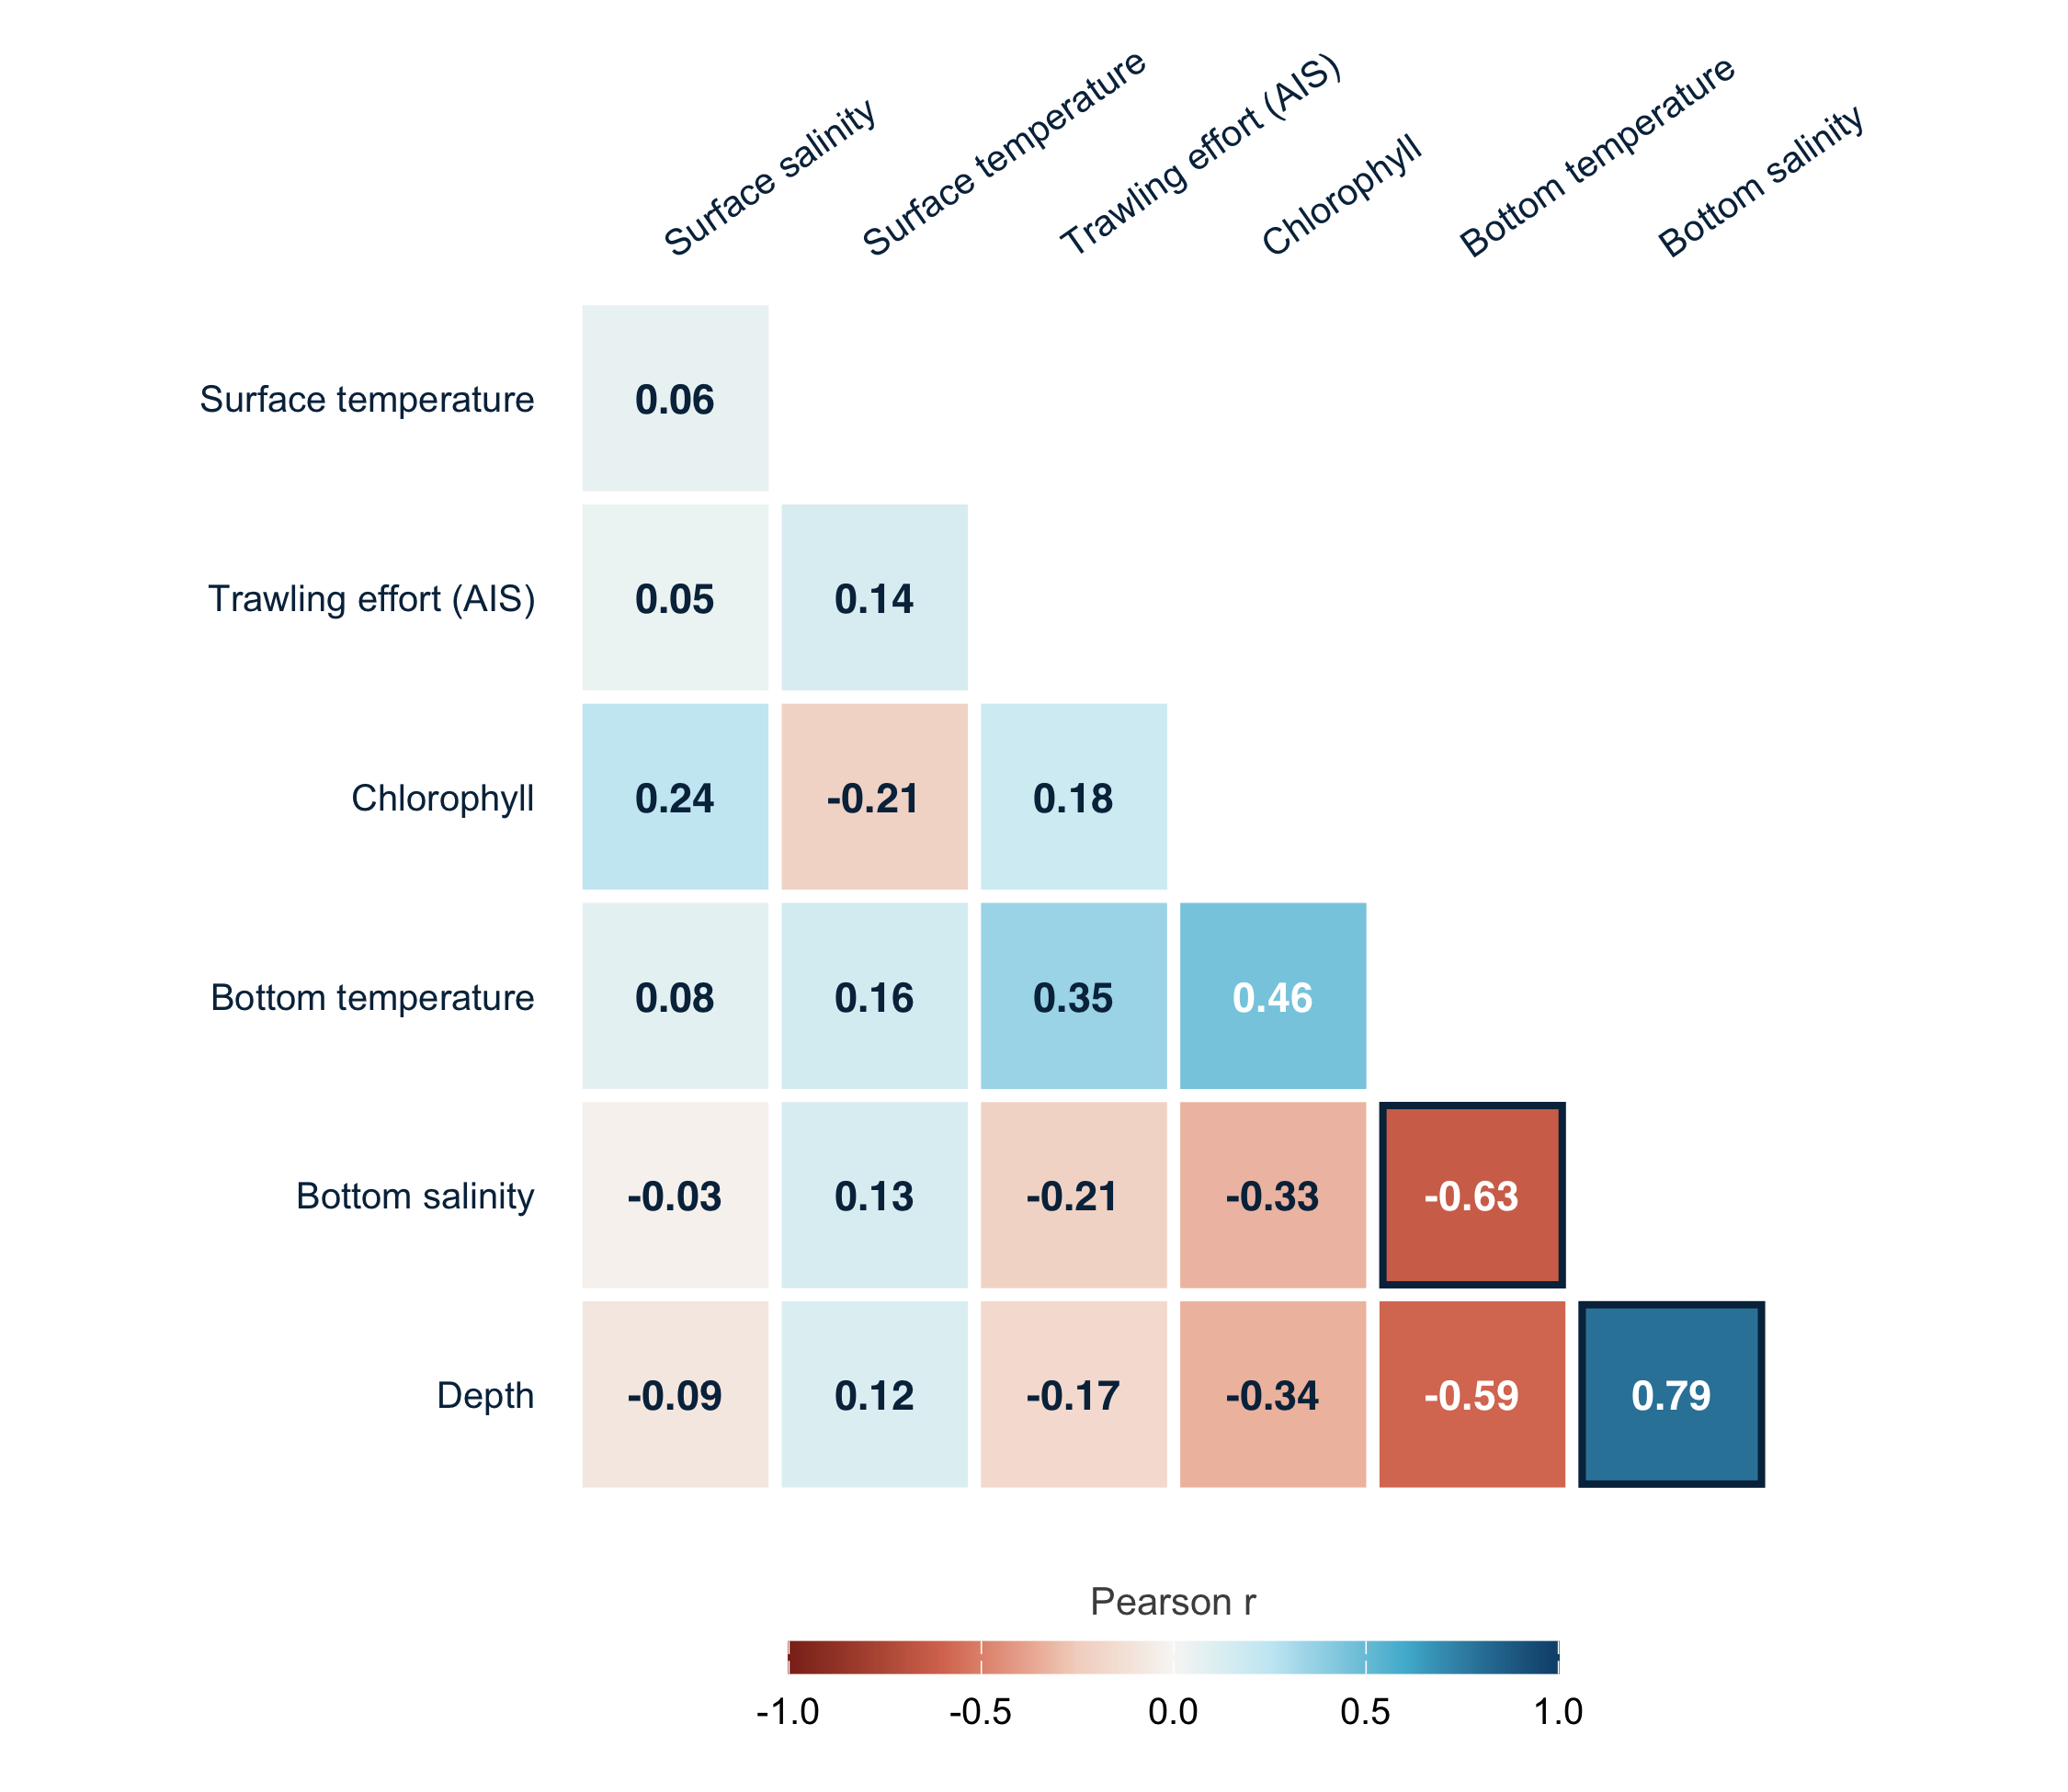
Total fish model: bottom salinity dropped (VIF 3.1; r = 0.79 with depth)
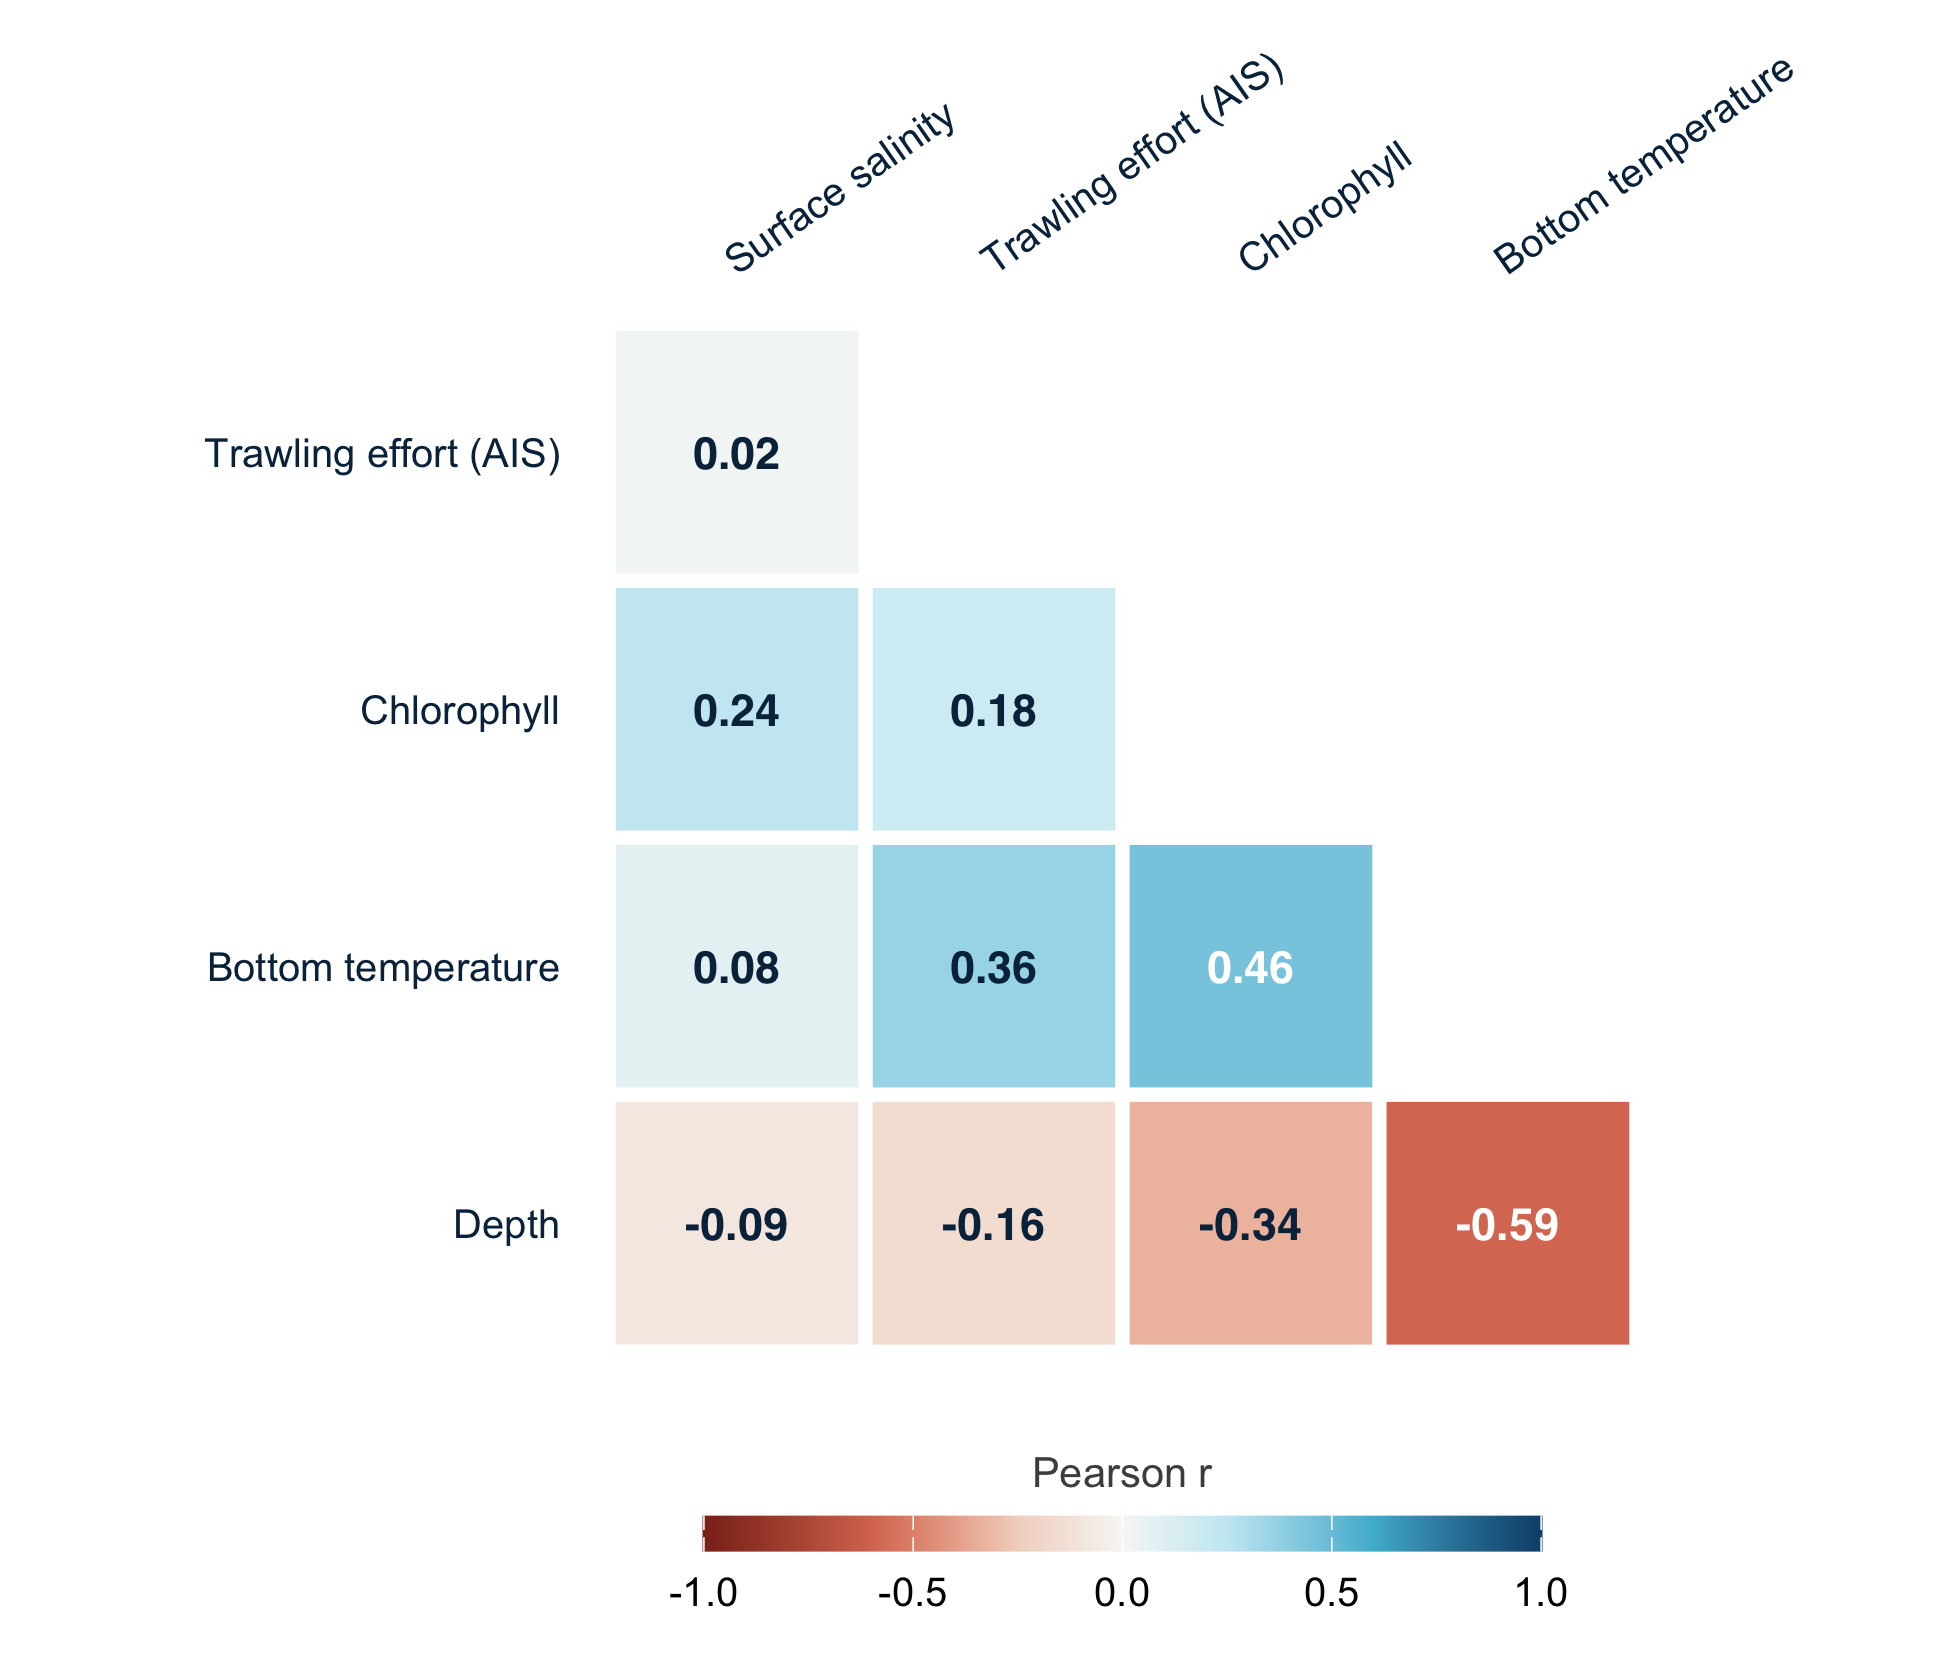
Red mullet model: all VIF ≤ 1.9
Residual diagnostics
Total fish (Gaussian, standardised residuals)
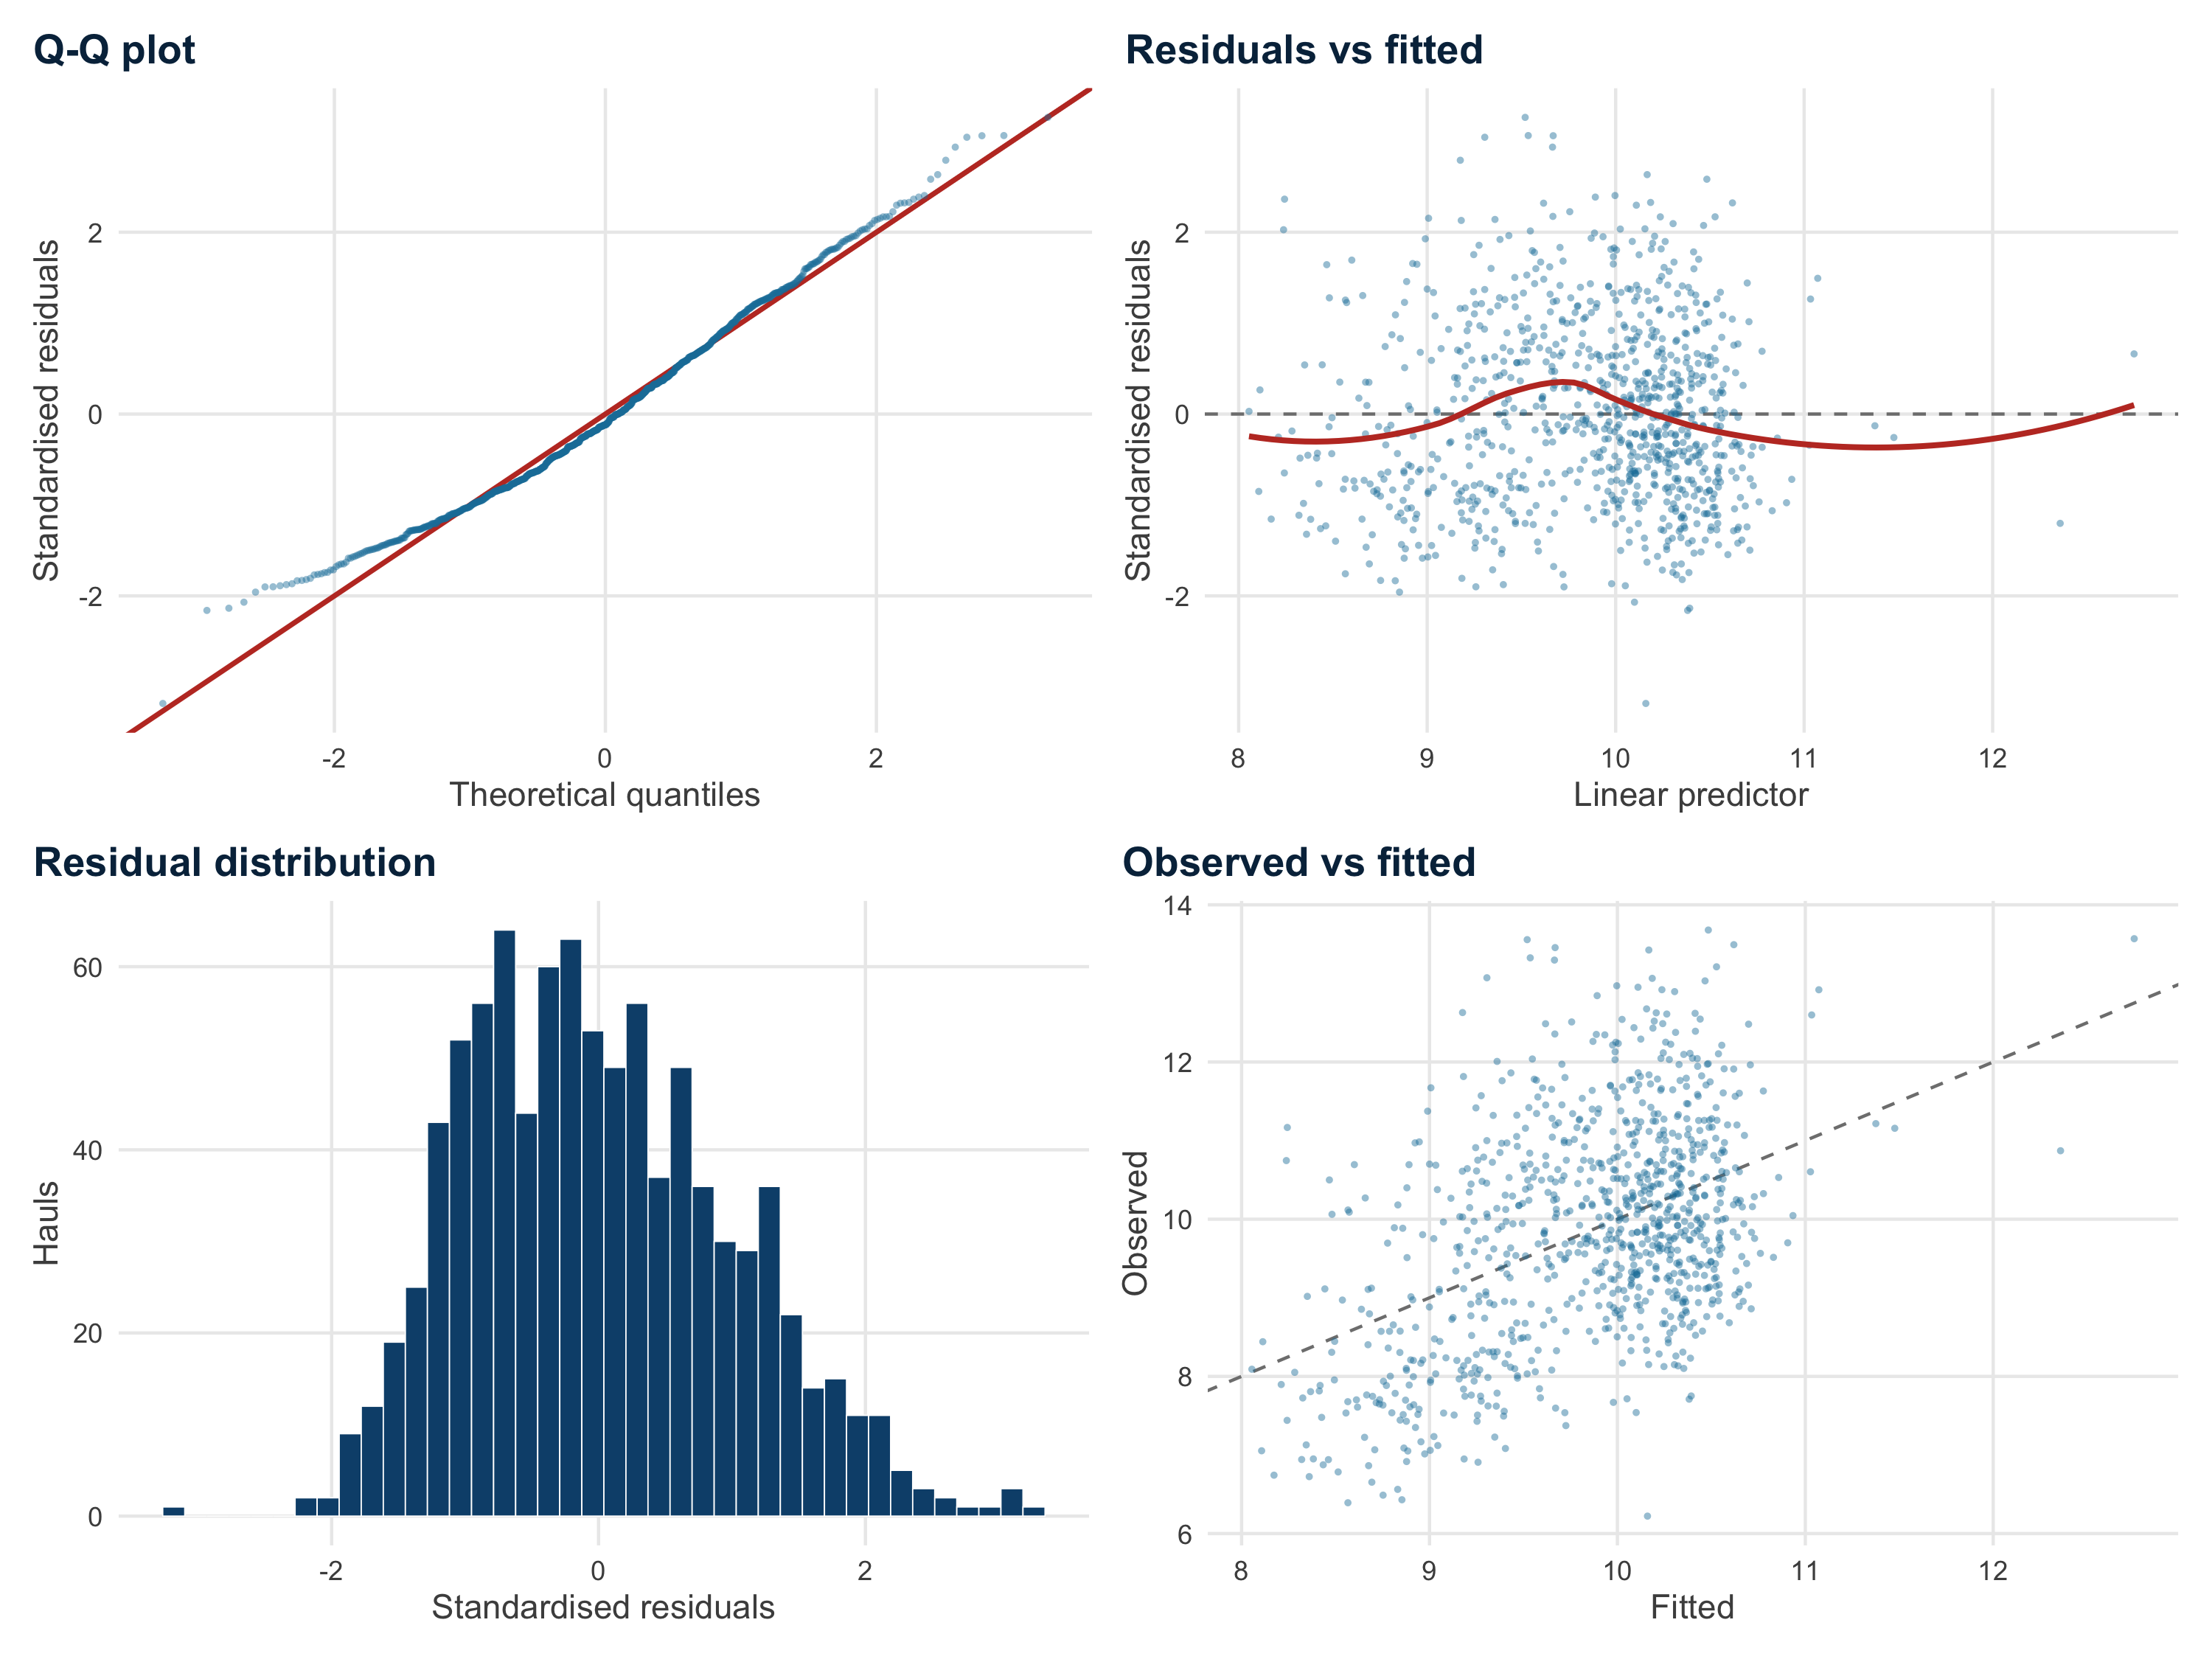
k-index ≈ 1 for all terms (all p ≥ 0.20)
Red mullet (Tweedie, simulated quantile residuals)
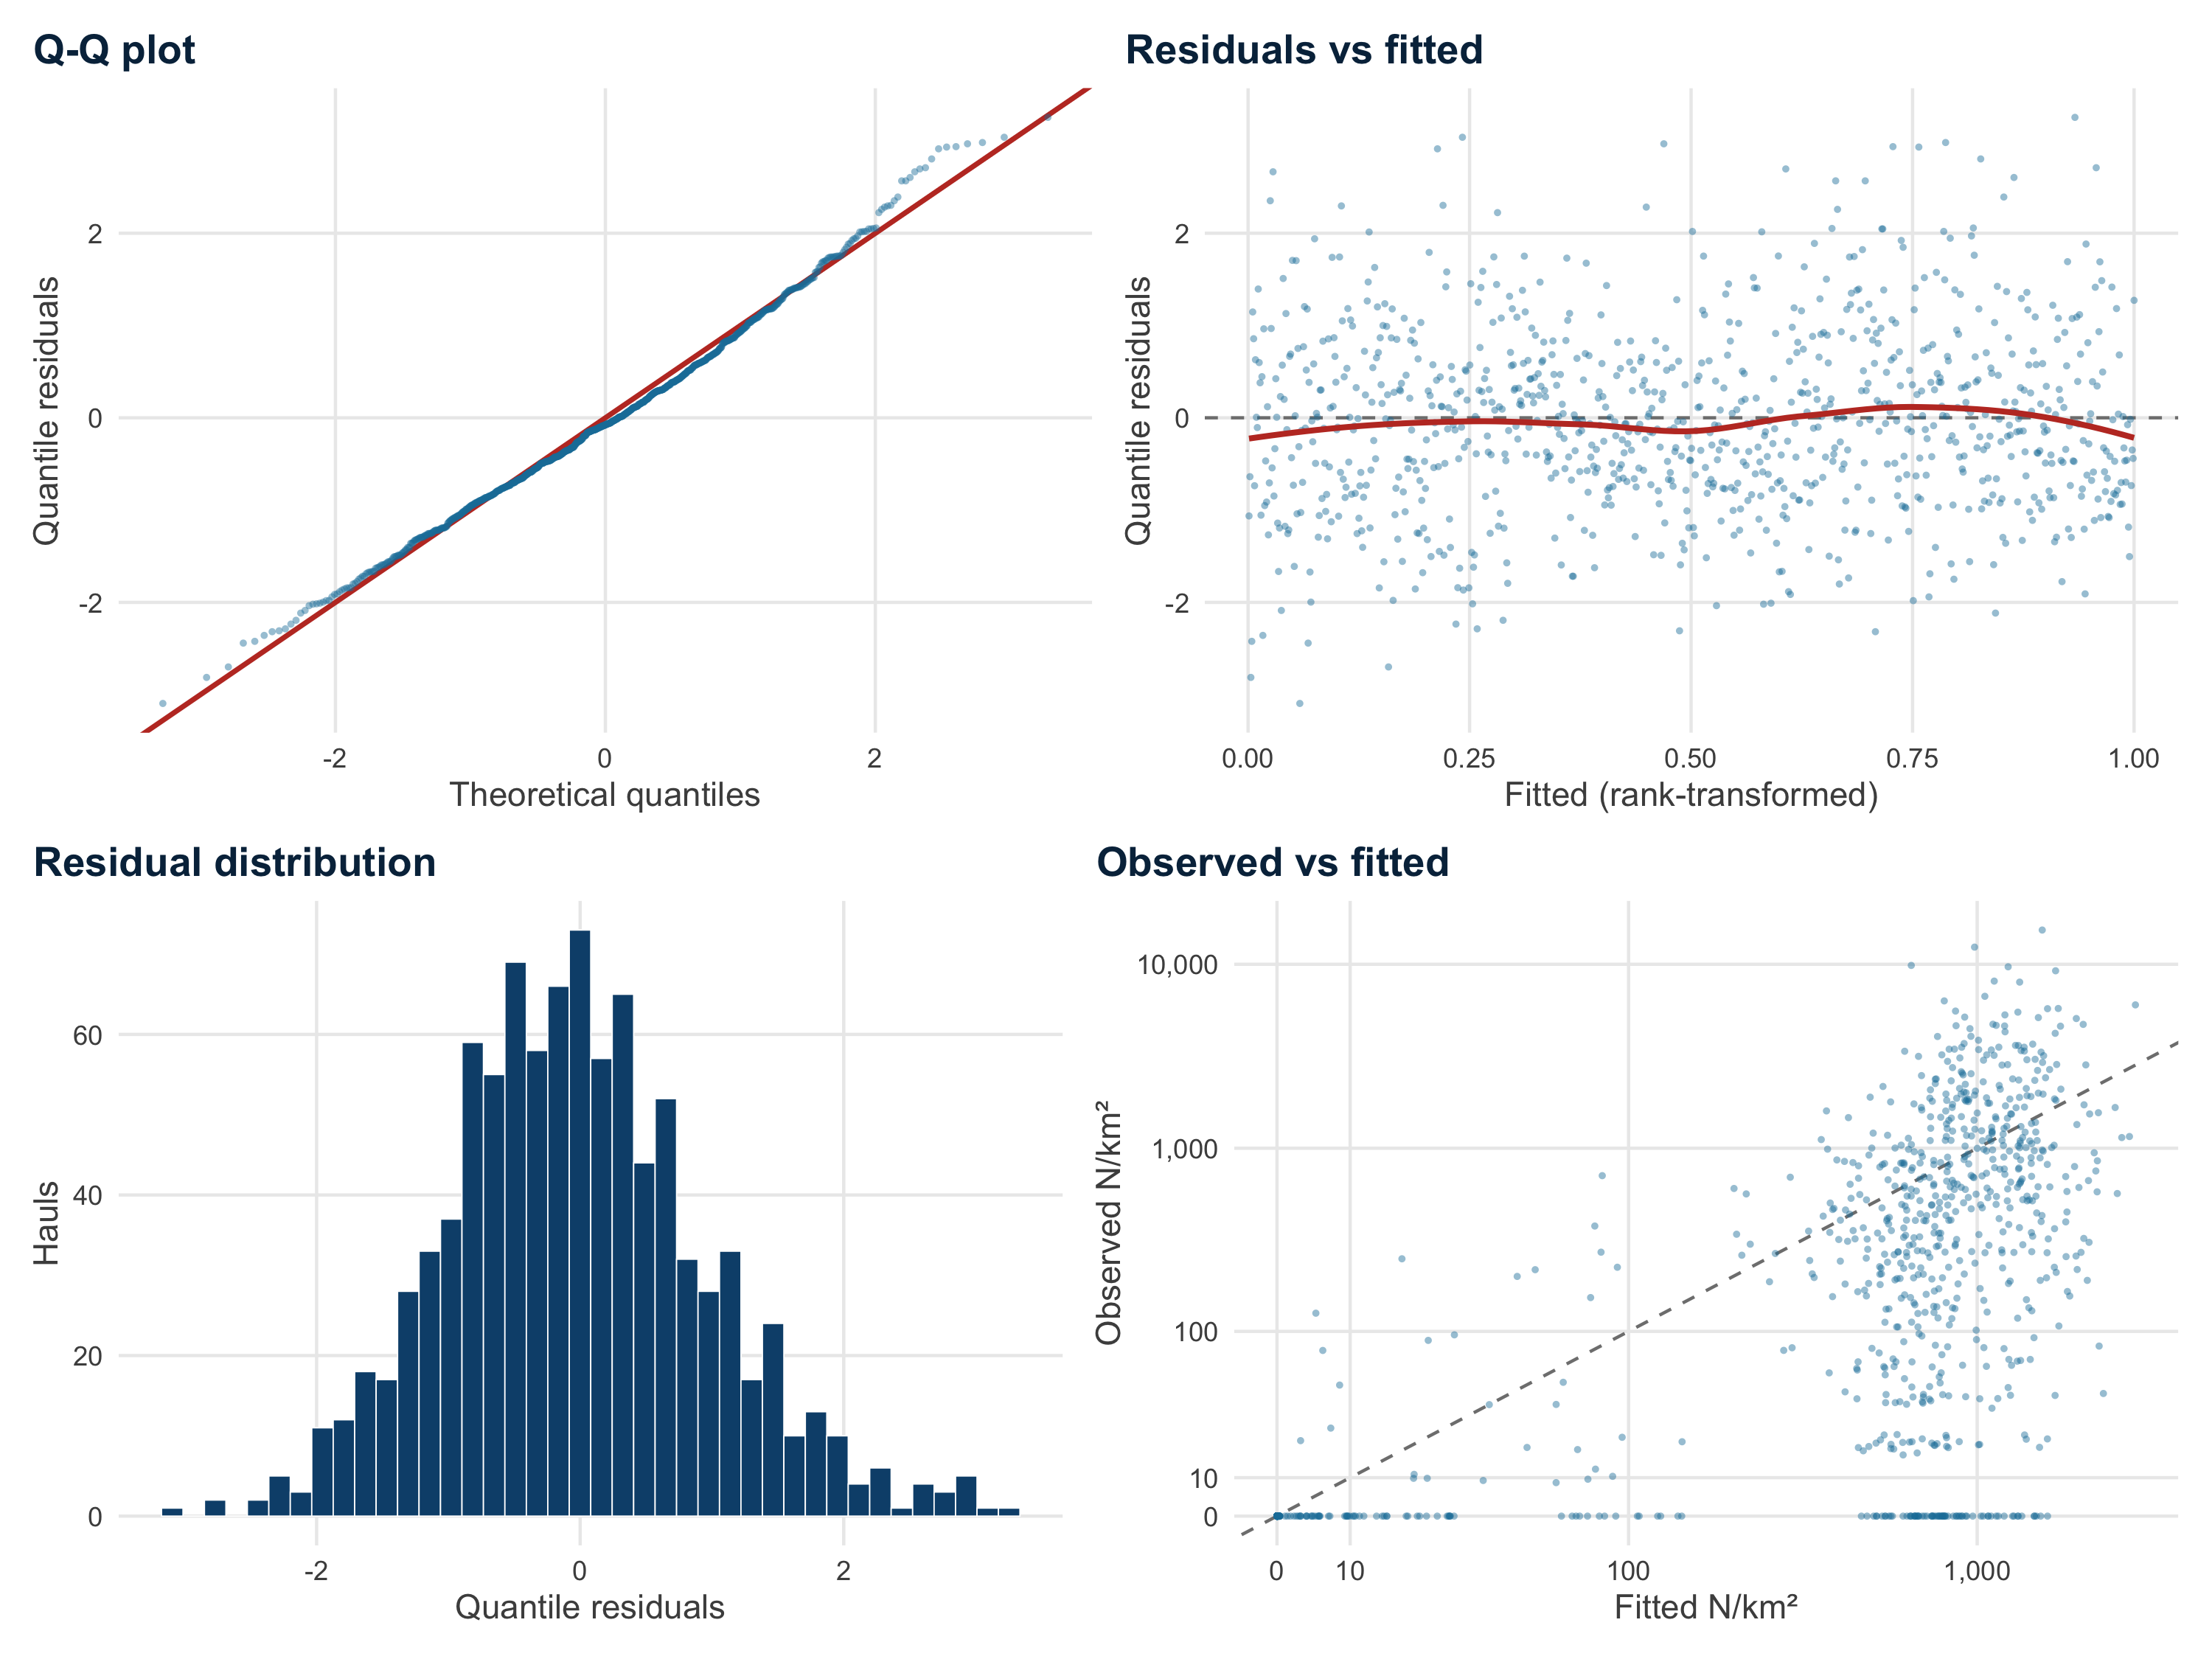
Good overall fit; zero-catch hauls often predicted at several hundred N/km²
Red mullet and depth
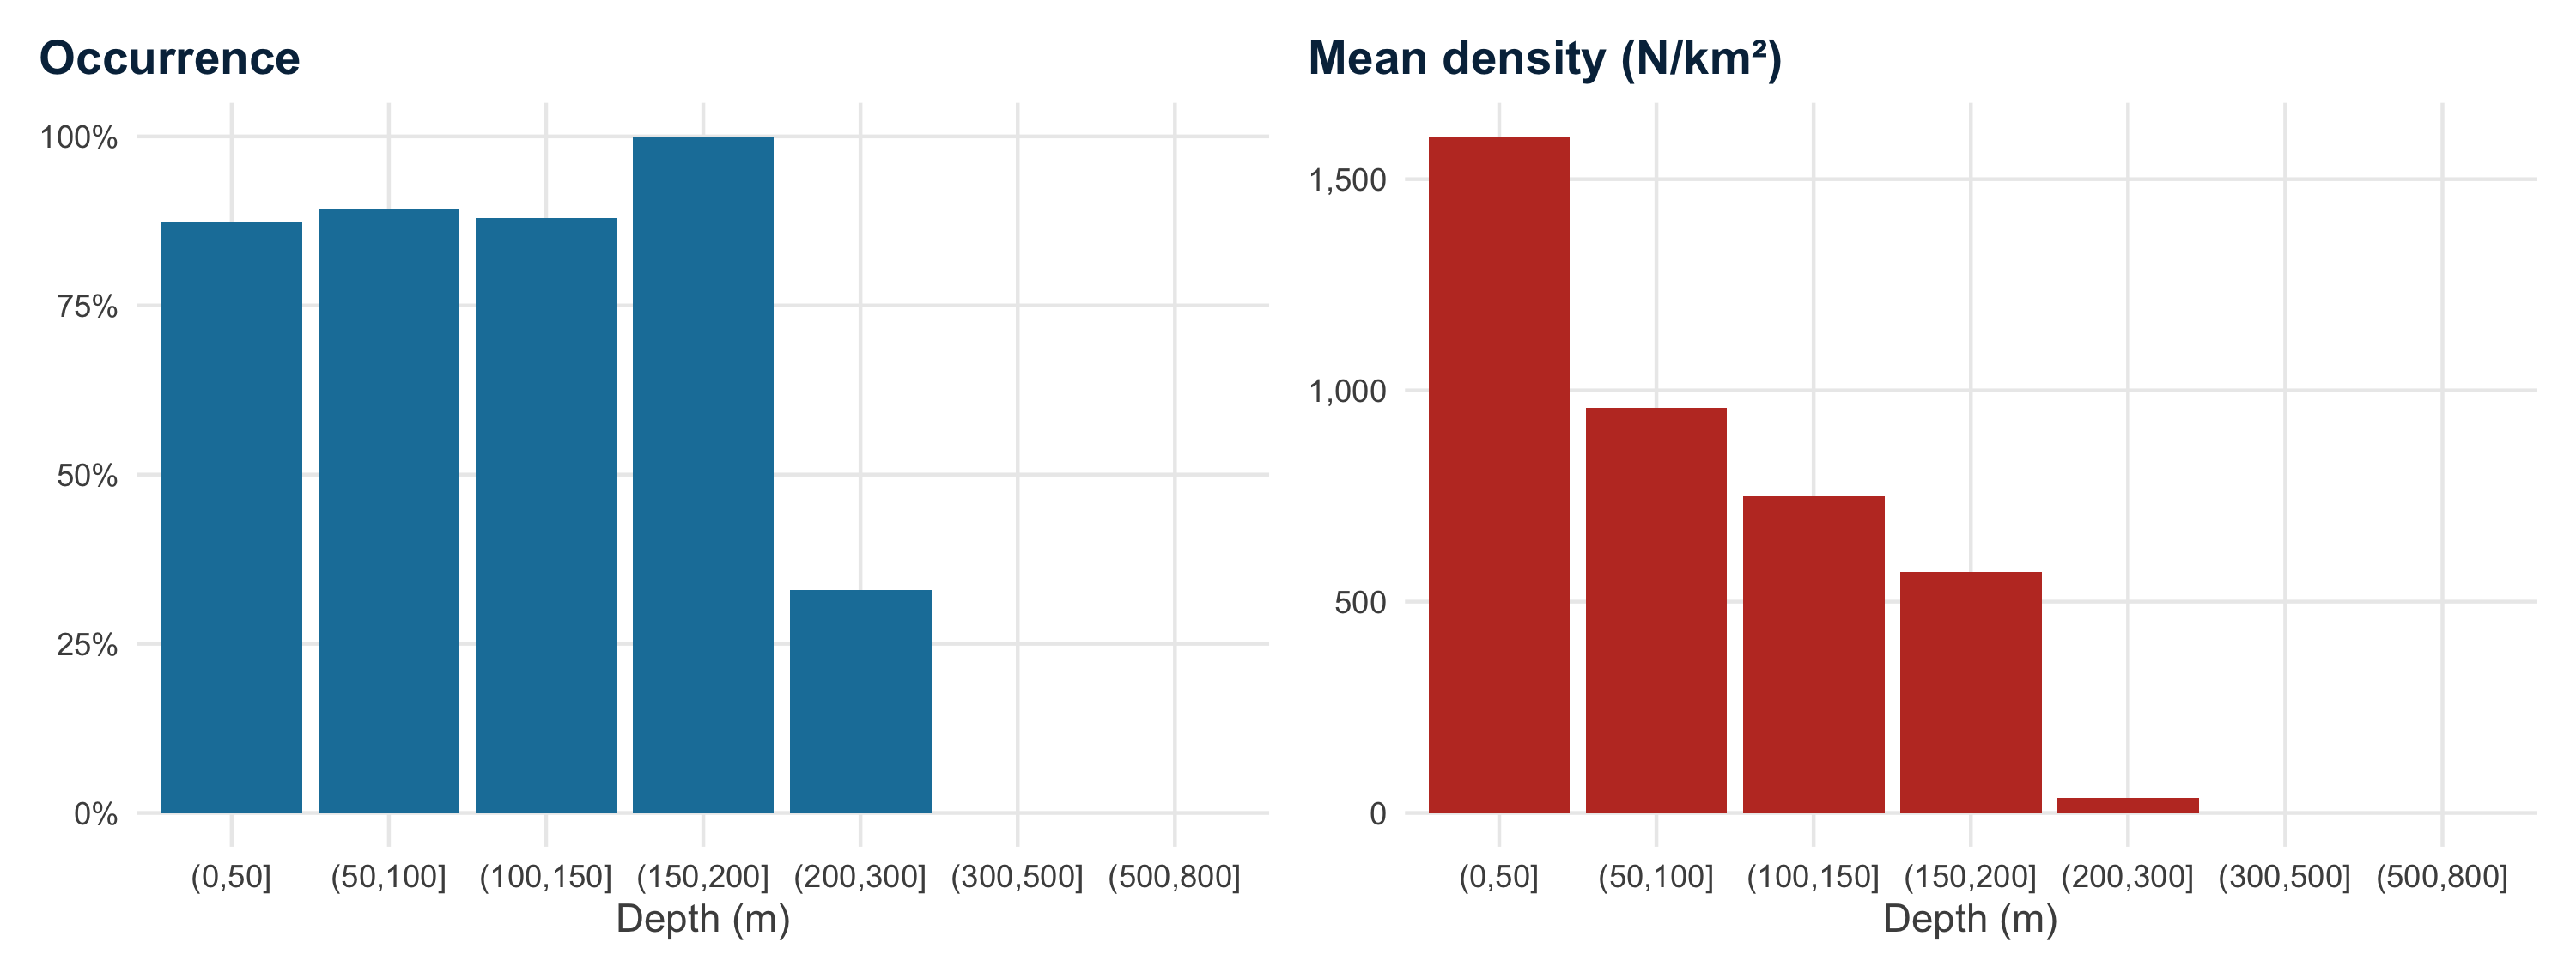
Occurrence and mean density by haul depth, GSA 6 MEDITS hauls 2012-2021